 DispatchSEO
The dashboard, page by page
What each dashboard screen shows, what you can do there, and when to open it.
On this page
The sidebar groups pages by what they're for, not how they're built: Performance, Content, Growth, System - with Home on its own at the top and Settings (plus Billing on cloud) pinned at the bottom. This page walks through every one of them, in that order.
Home
/dashboard is the one screen built to answer "what needs me right now."
Everything else on it is either a status readout or a decision waiting on
you.
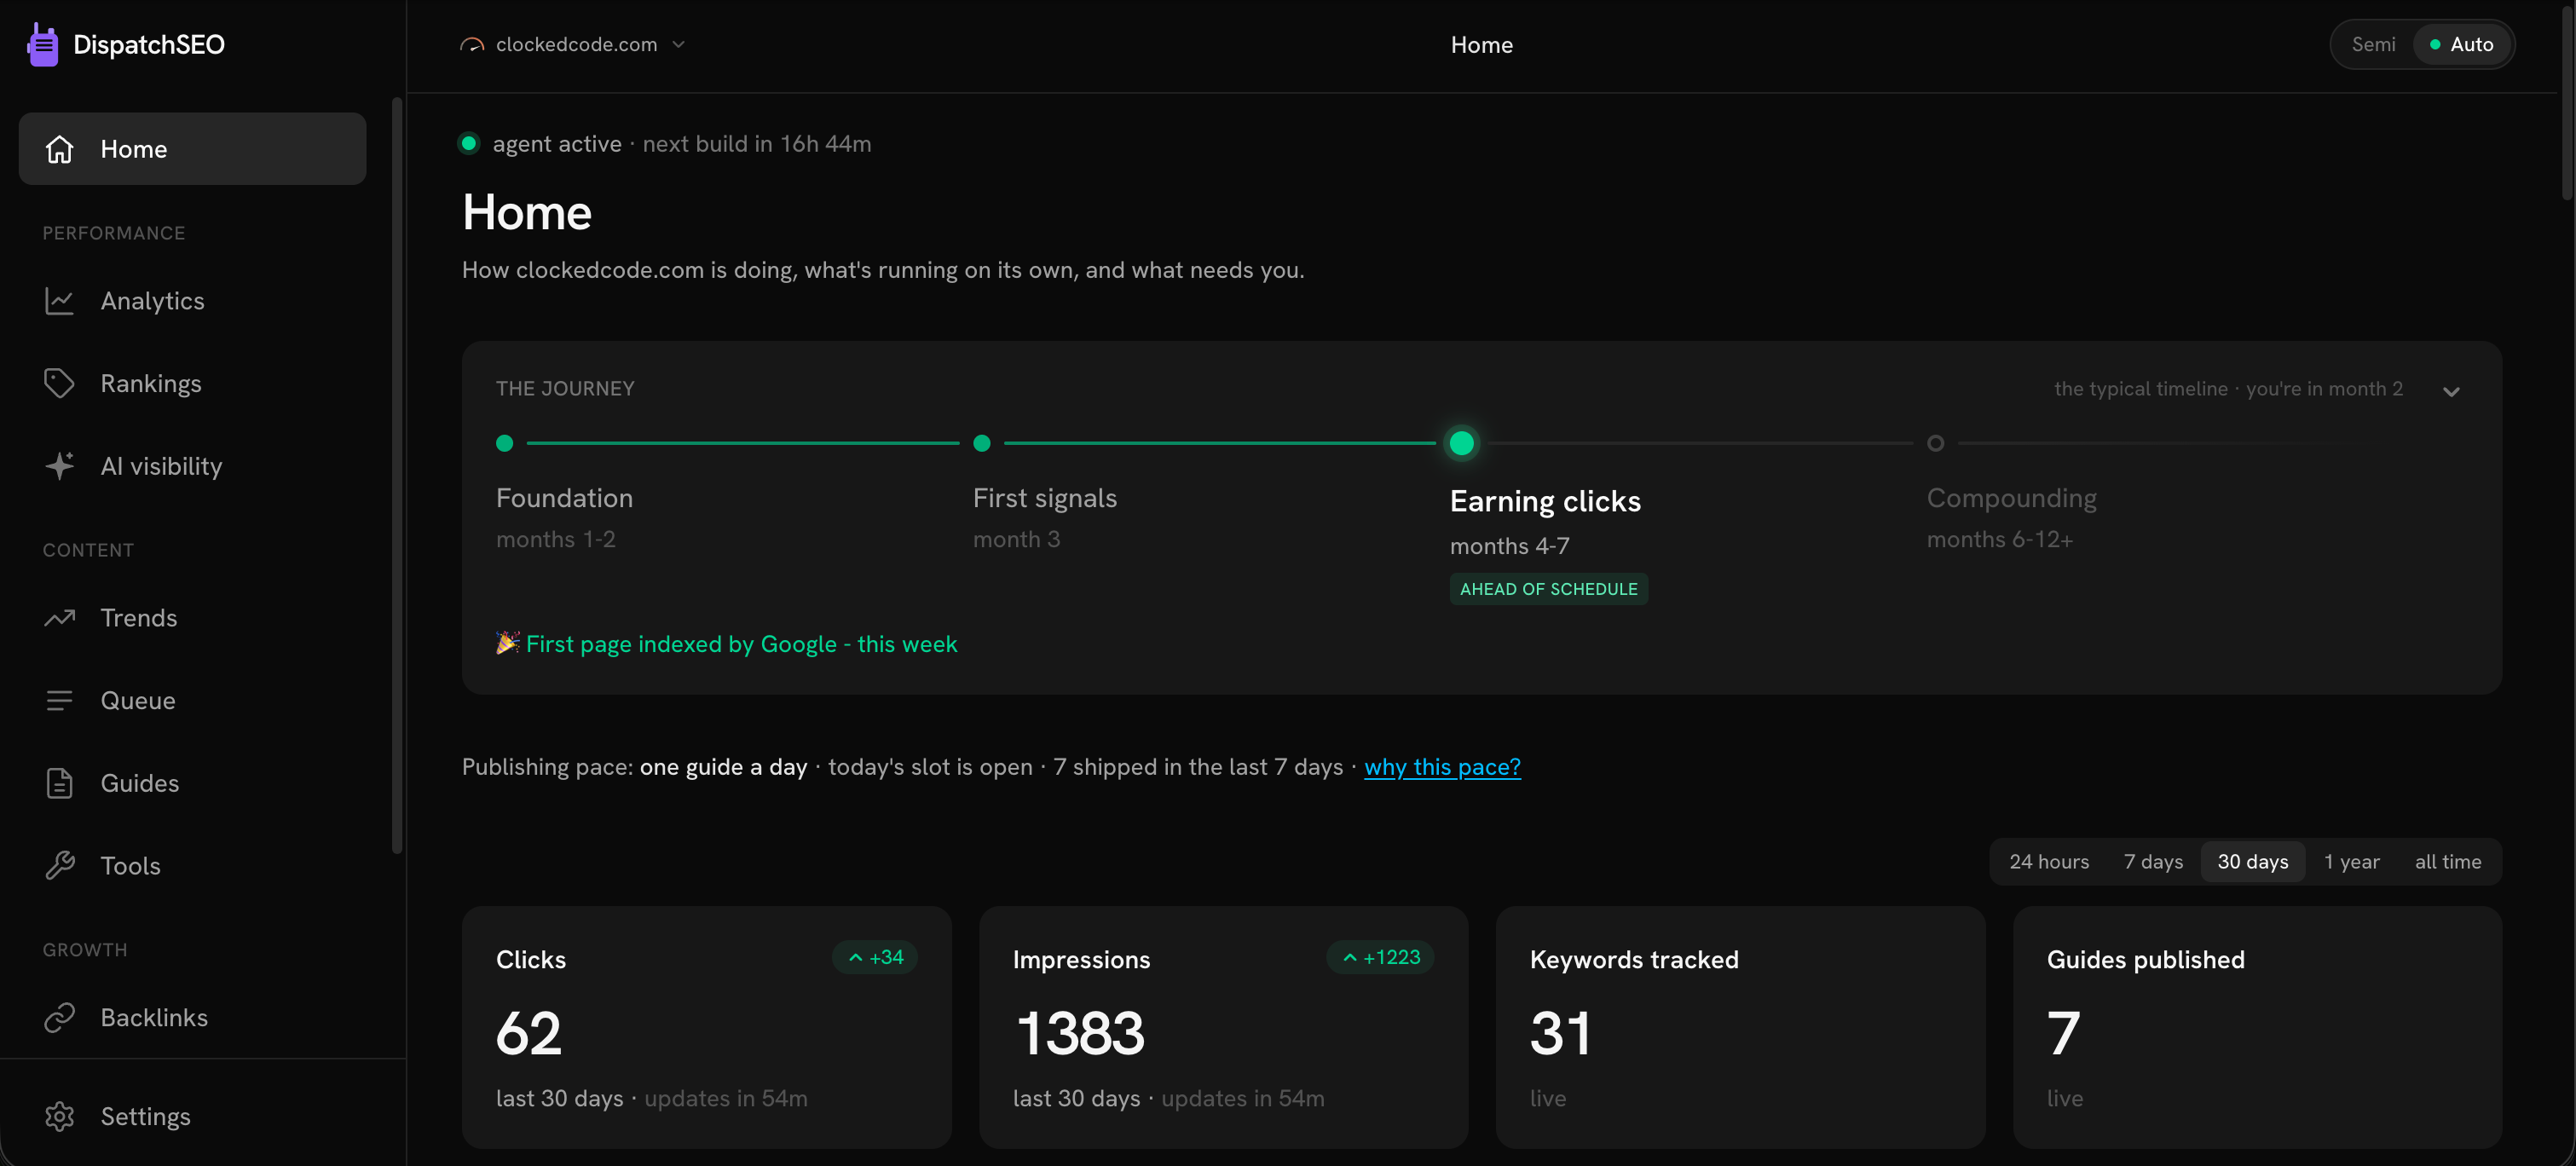
What it shows, top to bottom:
- An agent status pill (building, guides or tools queued, or an alert) once the pipeline is wired in and at least one builder automation is on.
- The dispatcher's briefing - what moved since yesterday, in the agent's own
words, with the full report one click away (the same text the
get_briefingtool returns). - Any banners worth interrupting you for: a failing background job, a DataForSEO usage warning, a pipeline update waiting to be applied.
- The progress story - what stage the site is in and this week's movers.
- The publishing pace line (see Automations and modes for what it means).
- A stat row: search clicks, keywords tracked, guides published.
- The search traffic graph and a traffic-by-page breakdown.
- An Analytics teaser (Domain Rating, keyword rankings, clicks) that links through to the full page.
- An AI visibility teaser.
- The trend radar - the newest subjects and ideas waiting on a call, with a link to the rest on Trends.
- Next actions - PRs ready to merge (or already merging themselves), pending suggestions waiting on your approve or reject, and the "Get it on Google" indexing task for anything recently shipped.
- The backlink playbook's progress, and an activity log of what shipped today and this week.
What you do there: approve or reject suggestions, merge a PR, fire a trend scan, mark indexing requested, and work through the one-time setup cards.
Initial setup is a self-host concept: a stack of cards (connect DataForSEO, connect Search Console, connect GitHub, fund the DataForSEO account, set up alert email, install the pipeline, personalize the backlink playbook) that disappear one by one as each step verifies itself. On a cloud project the wizard does all of that in the background, so instead you get a much smaller Needs you section with at most two cards: reconnect the DispatchSEO GitHub App if it lost repo access, and connect Google Search Console if you skipped it during setup. Everything else is handled for you.
Analytics
/analytics is the deep-numbers page - visit it for the weekly "how's it
actually going" review.
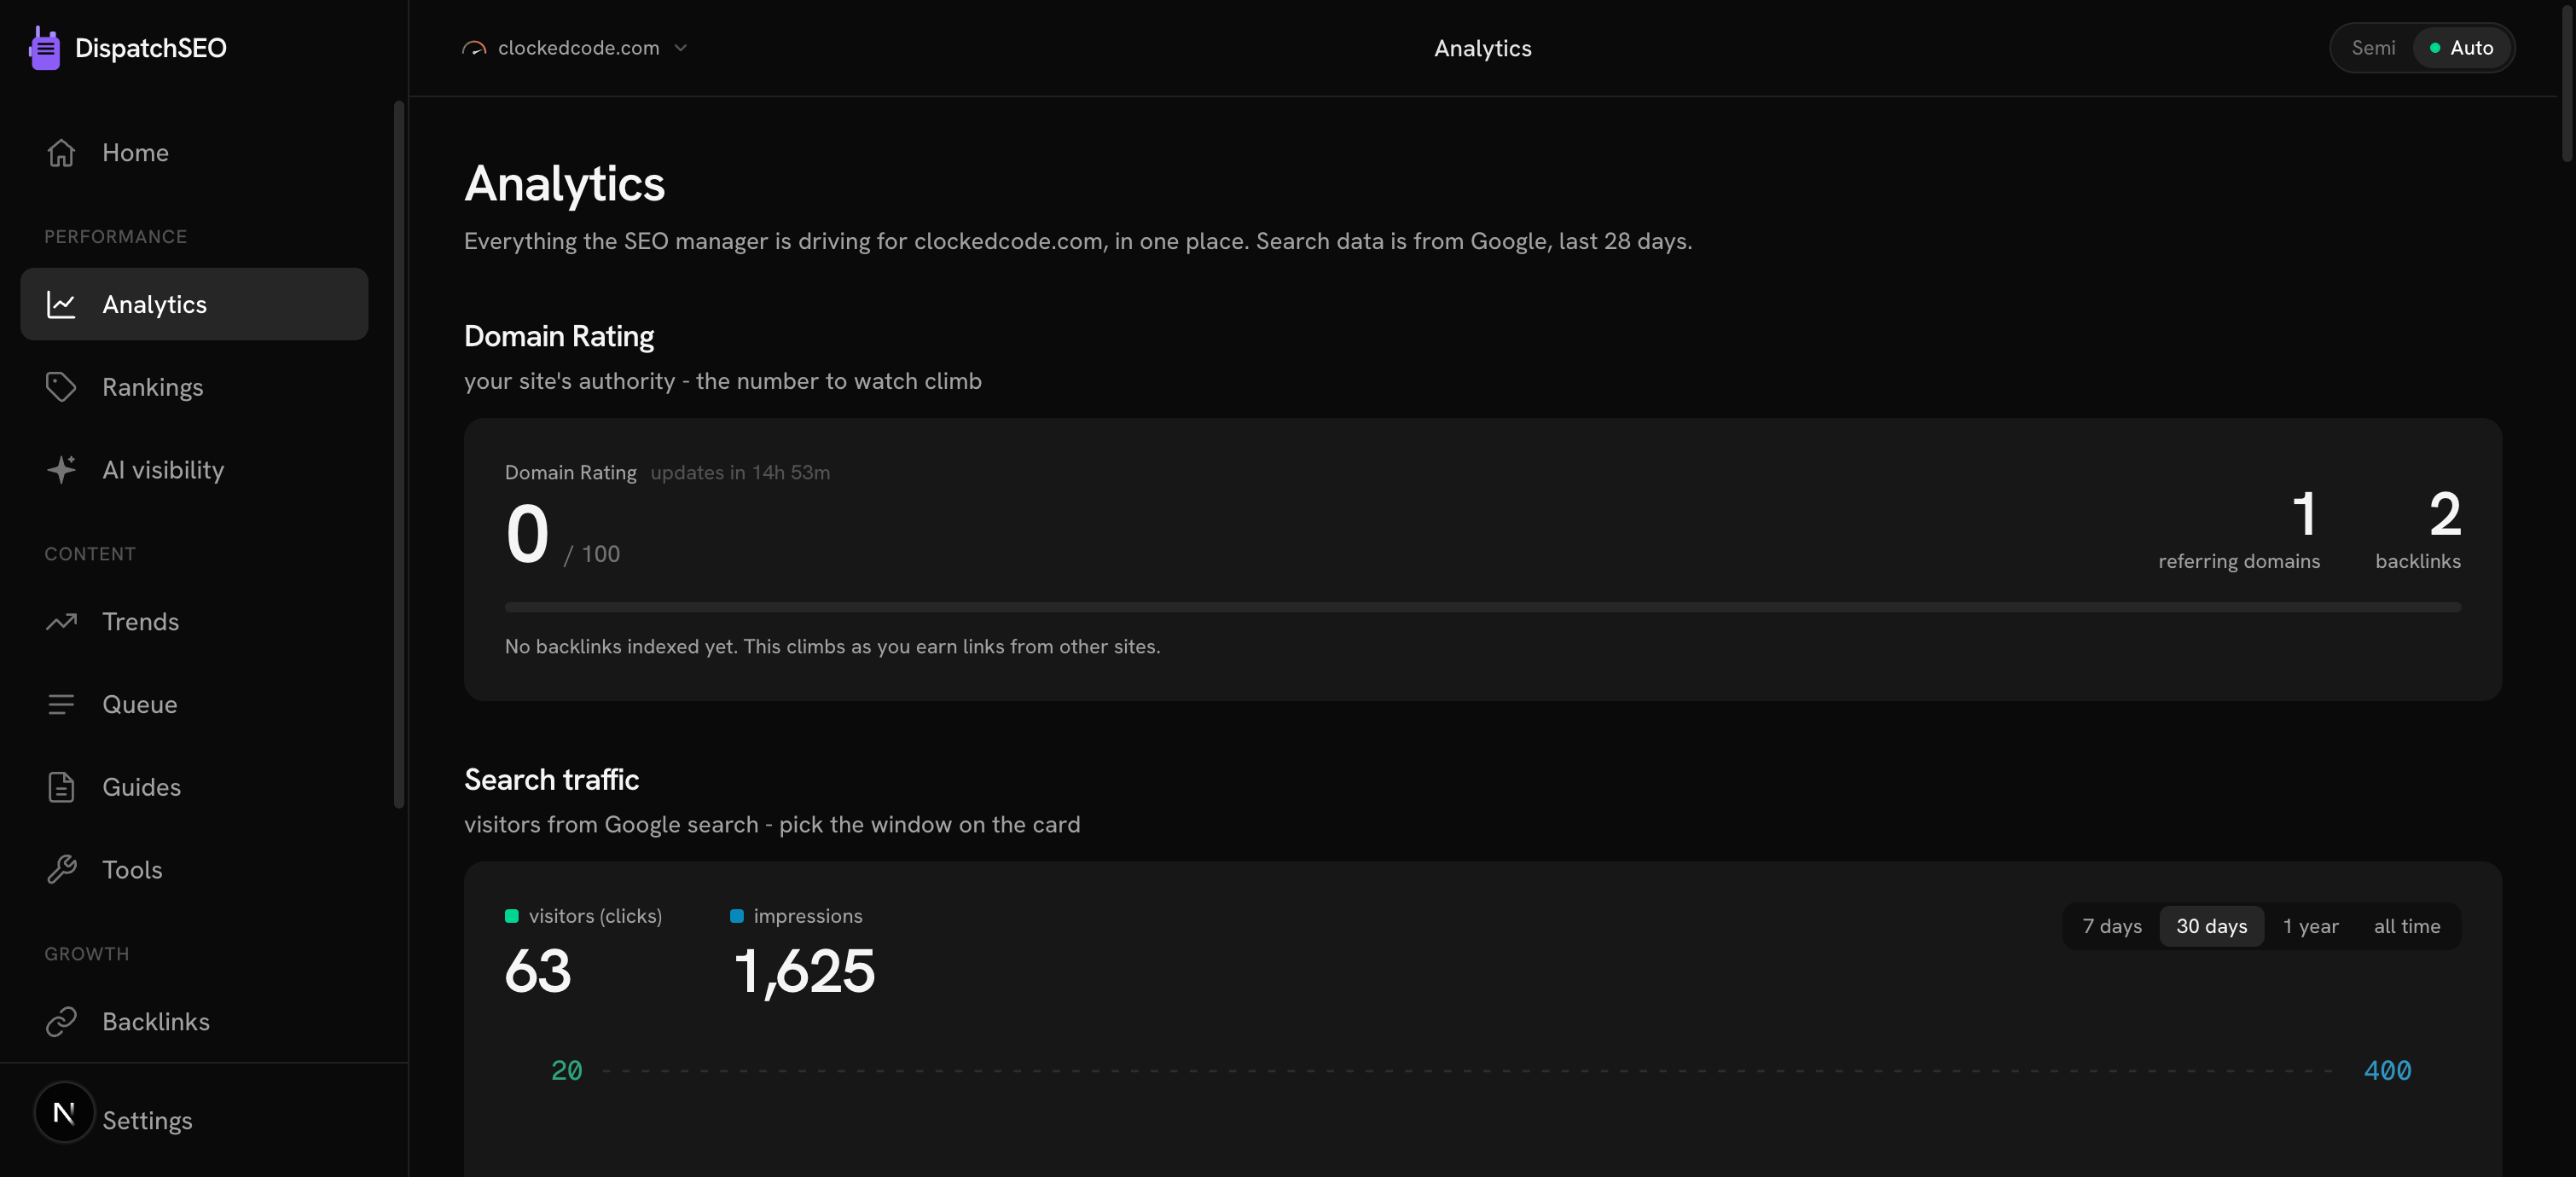
What it shows: Domain Rating, the search traffic chart with clicks, impressions, average position and click-through rate (each with a 14-days-vs-the-14-before delta), traffic by page, a traffic-by-guide table, a traffic-by-tool table, a keyword rankings table (top 20, with a link to the full table), and top search queries. Nothing here is editable - it's all read from Search Console and the nightly rank checks.
Rankings
/keywords is the full keyword table behind the Analytics teaser: every
tracked keyword's current position, a 7-day and 30-day delta arrow, and a
30-day sparkline, next to its search volume and difficulty. A stat row
above it totals keywords tracked, how many sit in the top 10, the average
position, and how many moved up this week.
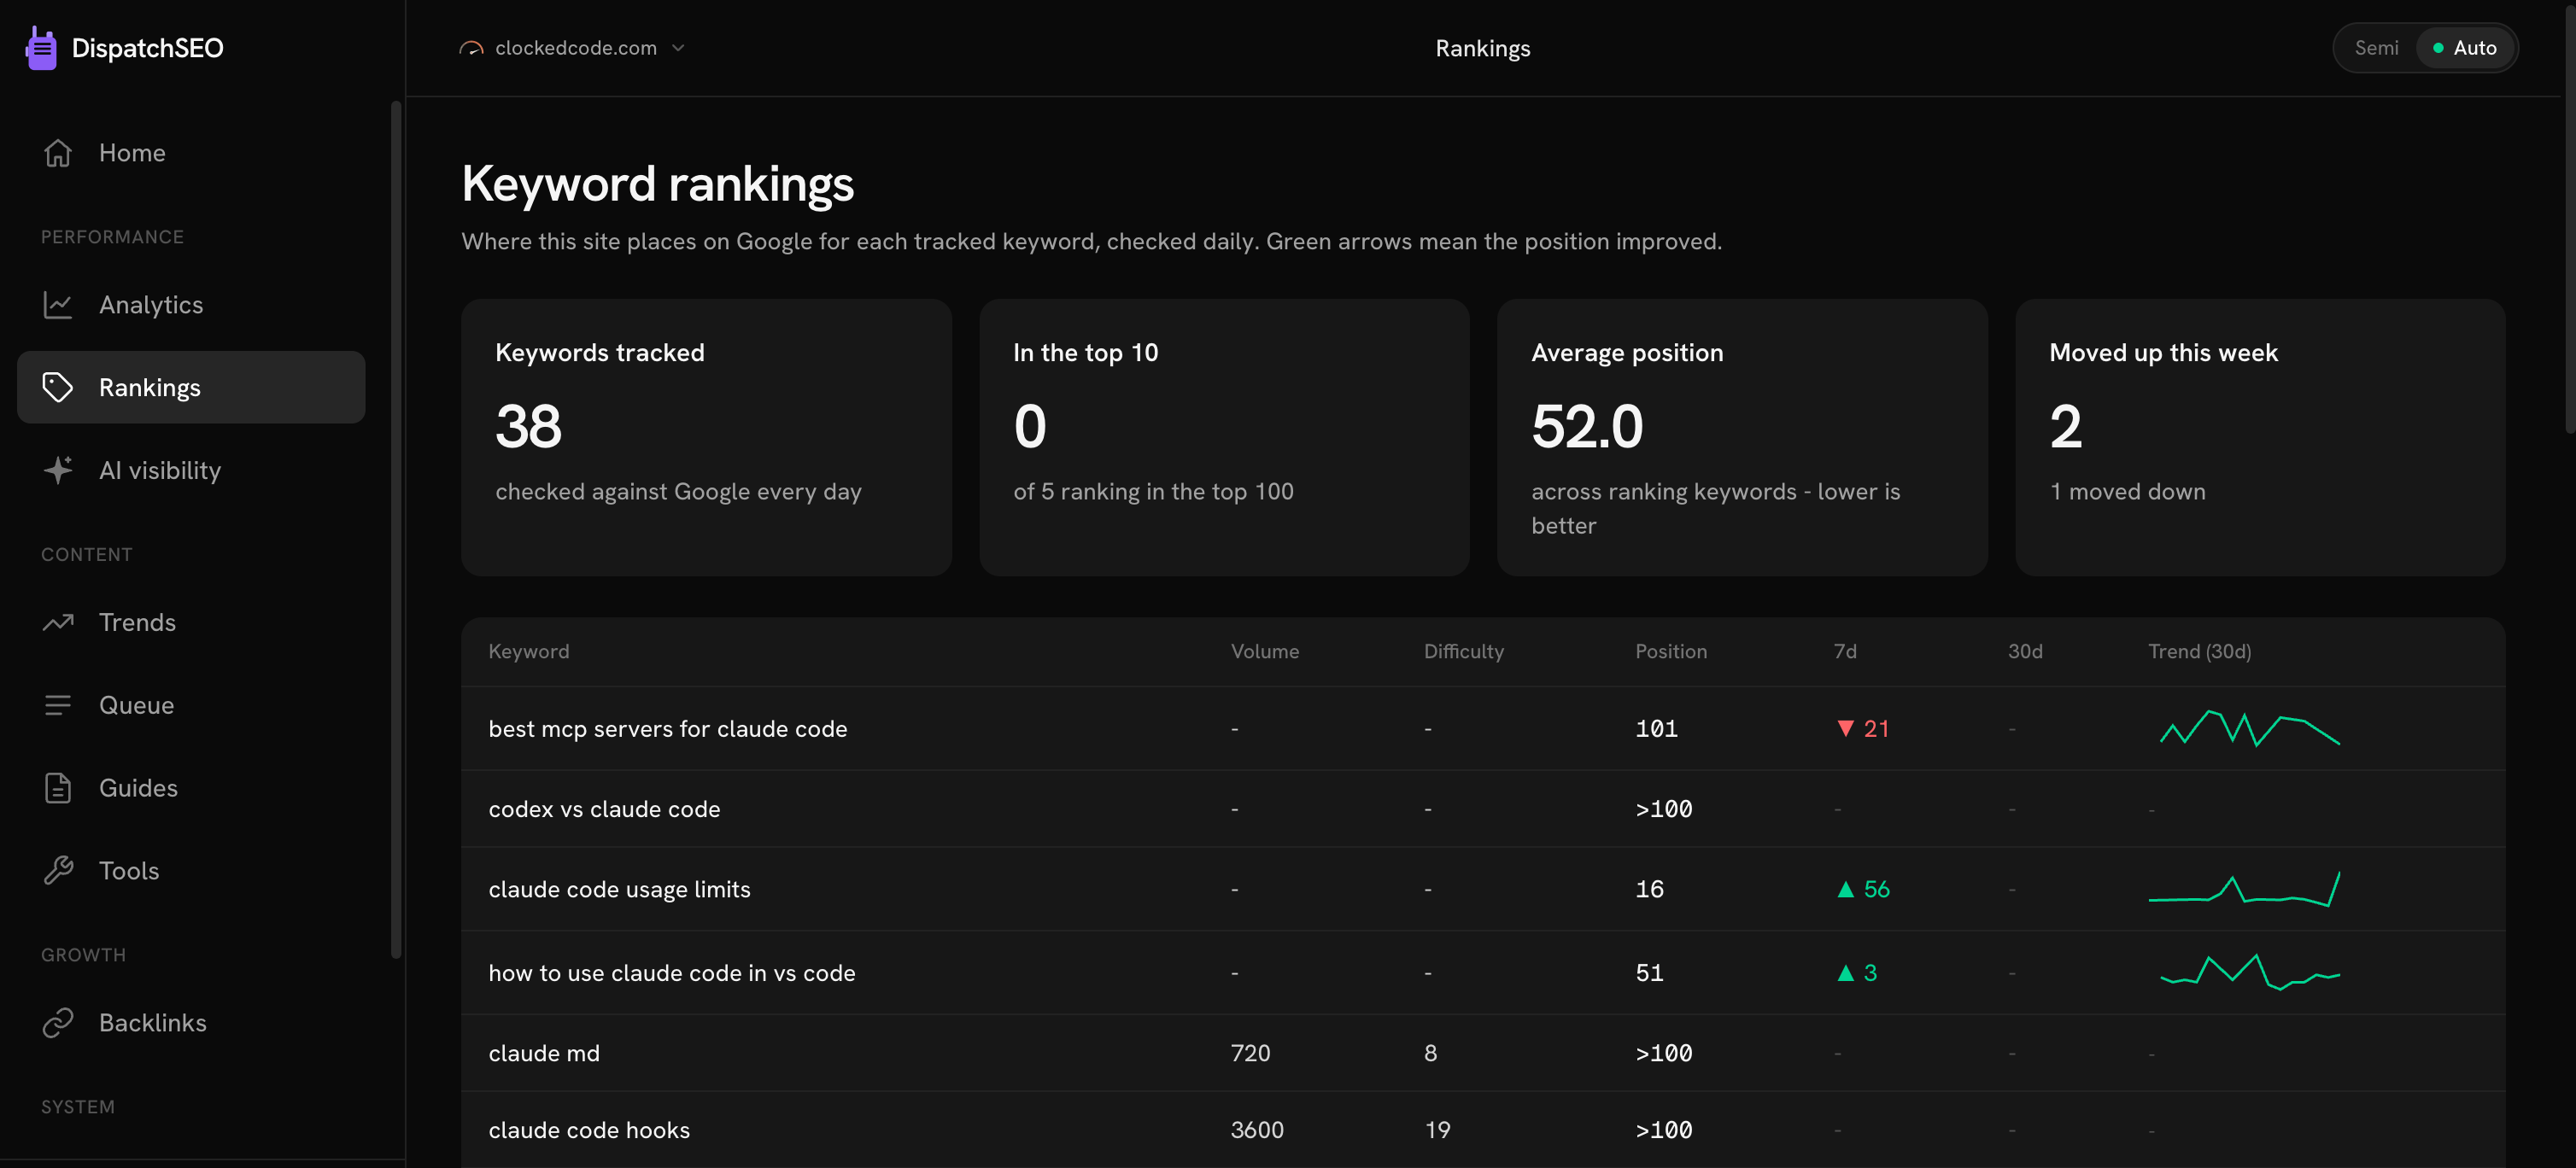
Read-only - keywords arrive from the weekly research run (or a manual
/seo-research). Open this page when you want to check whether one
specific keyword moved.
AI visibility
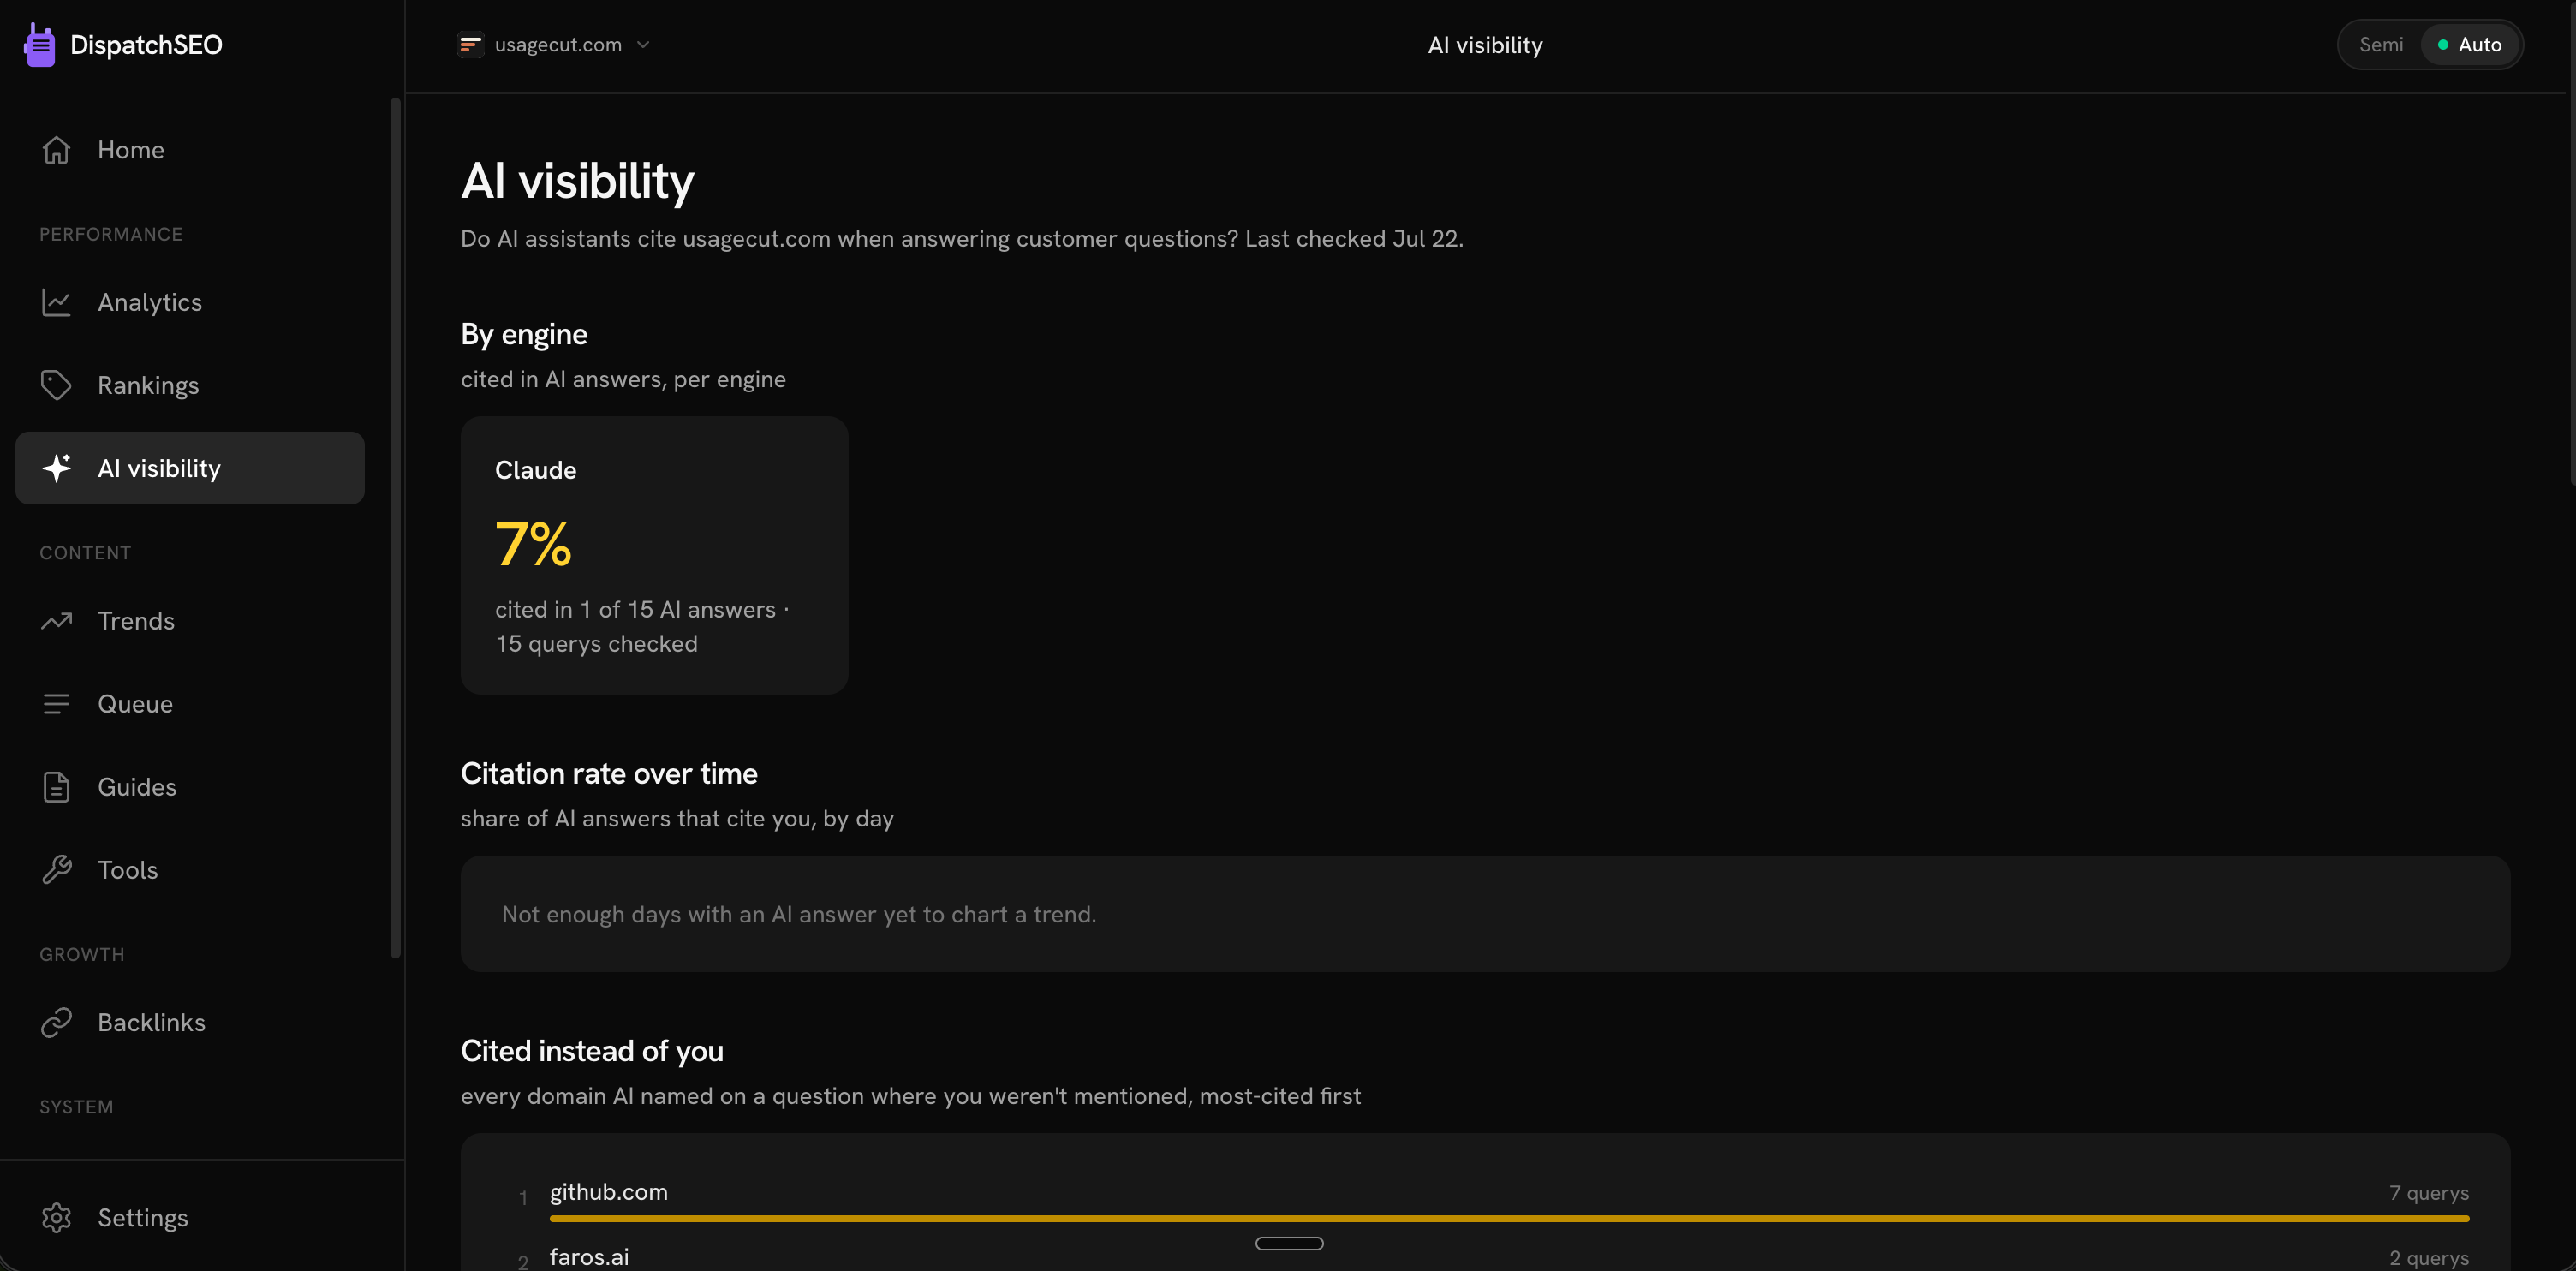
/ai tracks whether AI assistants cite the site when they answer a
customer's question - the GEO half of SEO. It shows a stat tile per engine
(Google AI Overview, Claude, ChatGPT, Perplexity, Gemini), a citation-rate
trend over time, a "Cited instead of you" list of the domains AI answers
named when they didn't name this site, and a full query log you can expand
for the verbatim answer text and who got cited.
Google's AI Overview half rides the nightly rank check at no extra cost. The other four engines come from a separate scan that runs weekly, every Wednesday, on the owner's own Claude subscription.
Trends
/trends is the two-stage trend radar in full. On the radar lists the
subjects a scan caught - launches, Reddit and Hacker News buzz, Google
Trends - as evidence, nothing more. Pick one and hit Get takes and 3-5
validated guide angles land under it in Ideas - your call, where you
add each to the queue or skip it. In the build queue shows approved
trend ideas and which morning each one ships; Building now and
Shipped track what's already in motion, the latter with the search
traffic each trend guide has earned.
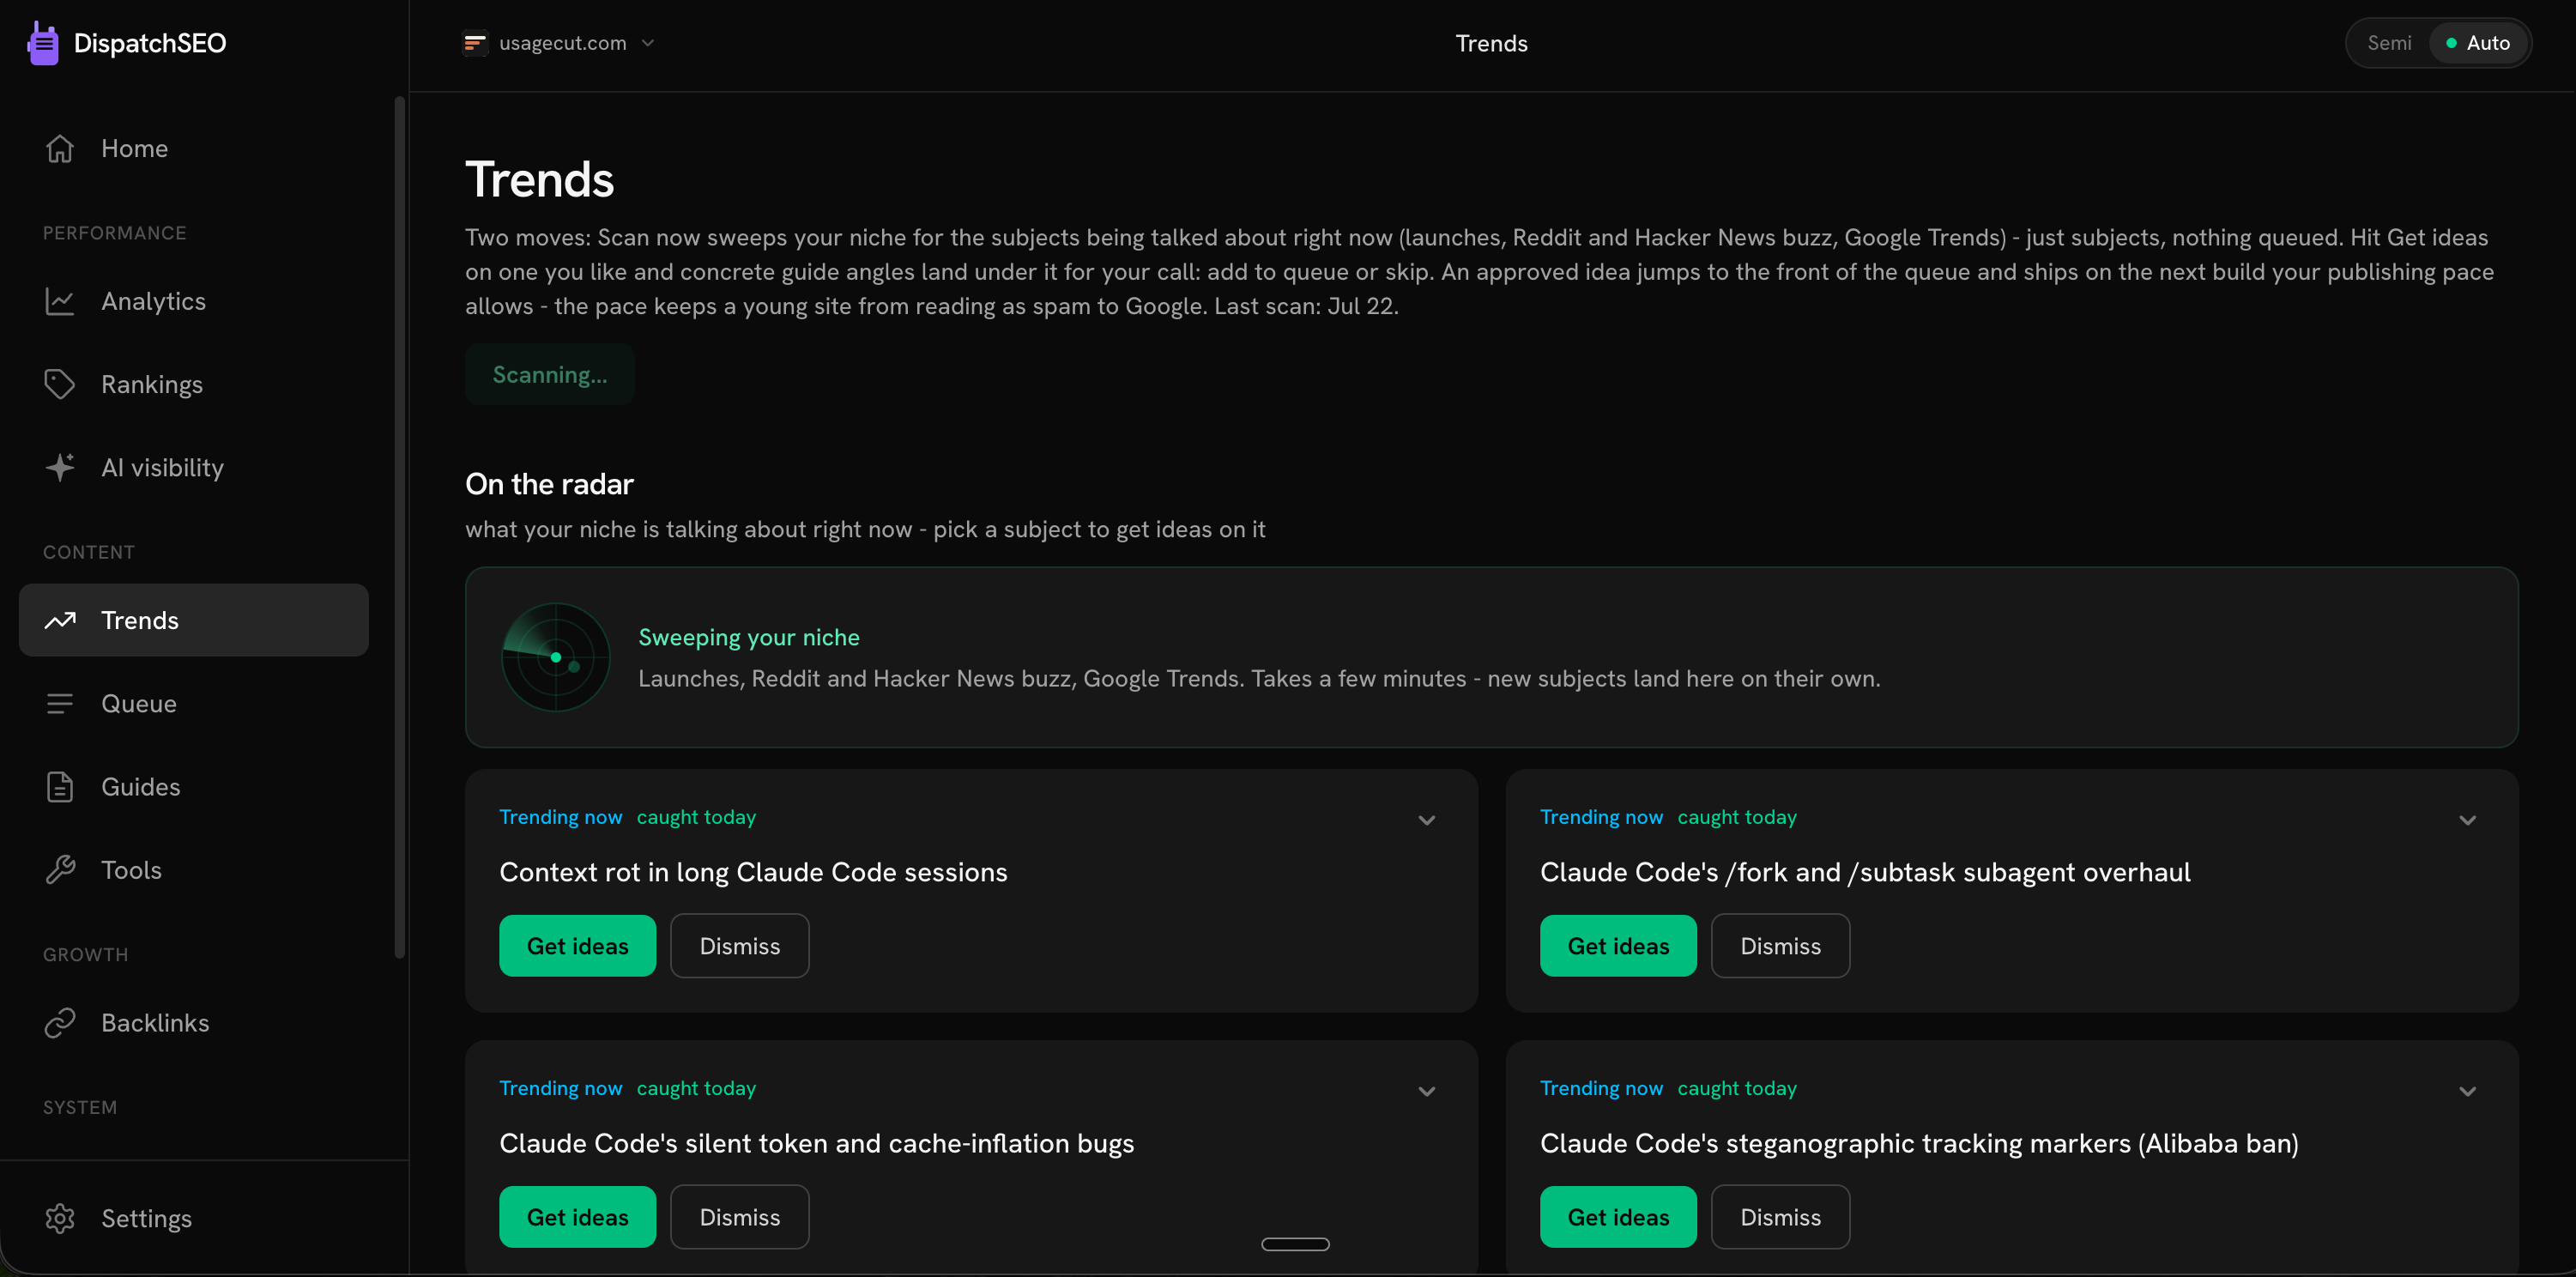
You do two things here: fire a scan (Scan now), and decide on what a scan turns up. Hype decays by the day, so this is a page worth checking often if you use it - nothing here builds without your approval.
Queue
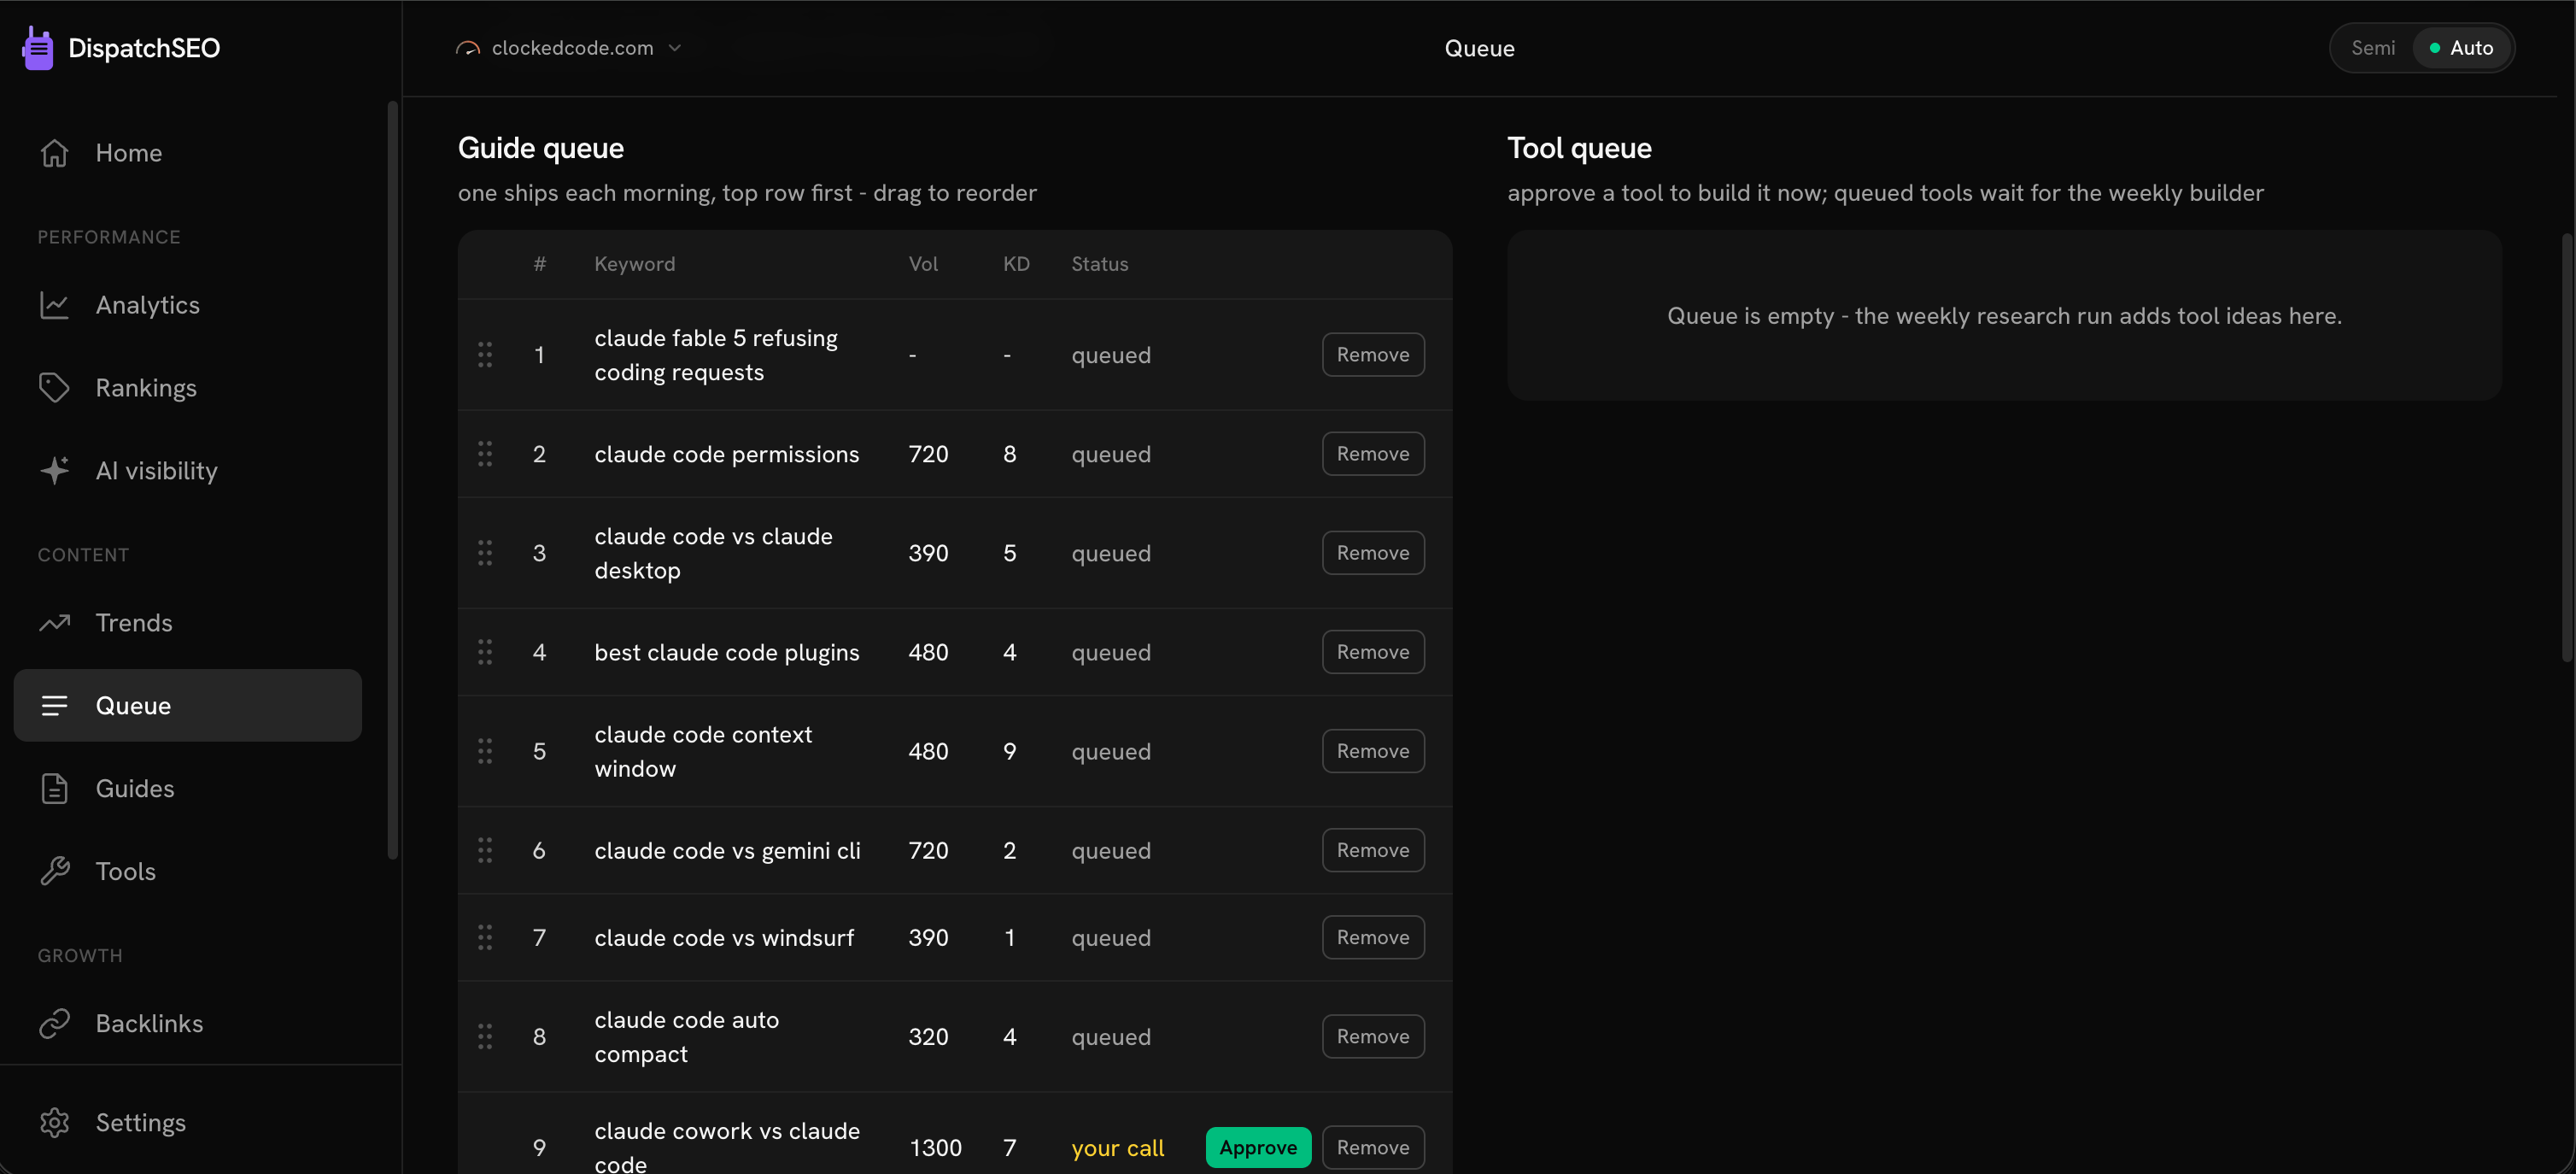
/research is the active build queue: the guide queue and the tool queue,
side by side, in build order - drag a row (or use the arrows on a narrow
screen) to reorder, and a pending row gets an inline approve button. A stat
row totals guides queued, tools queued, and how many have shipped so far.
An Add your own idea card lets you queue something the research run
didn't think of. A History section below keeps everything already
decided - shipped work and rejections, the latter with a Restore
button if you change your mind.
Guides
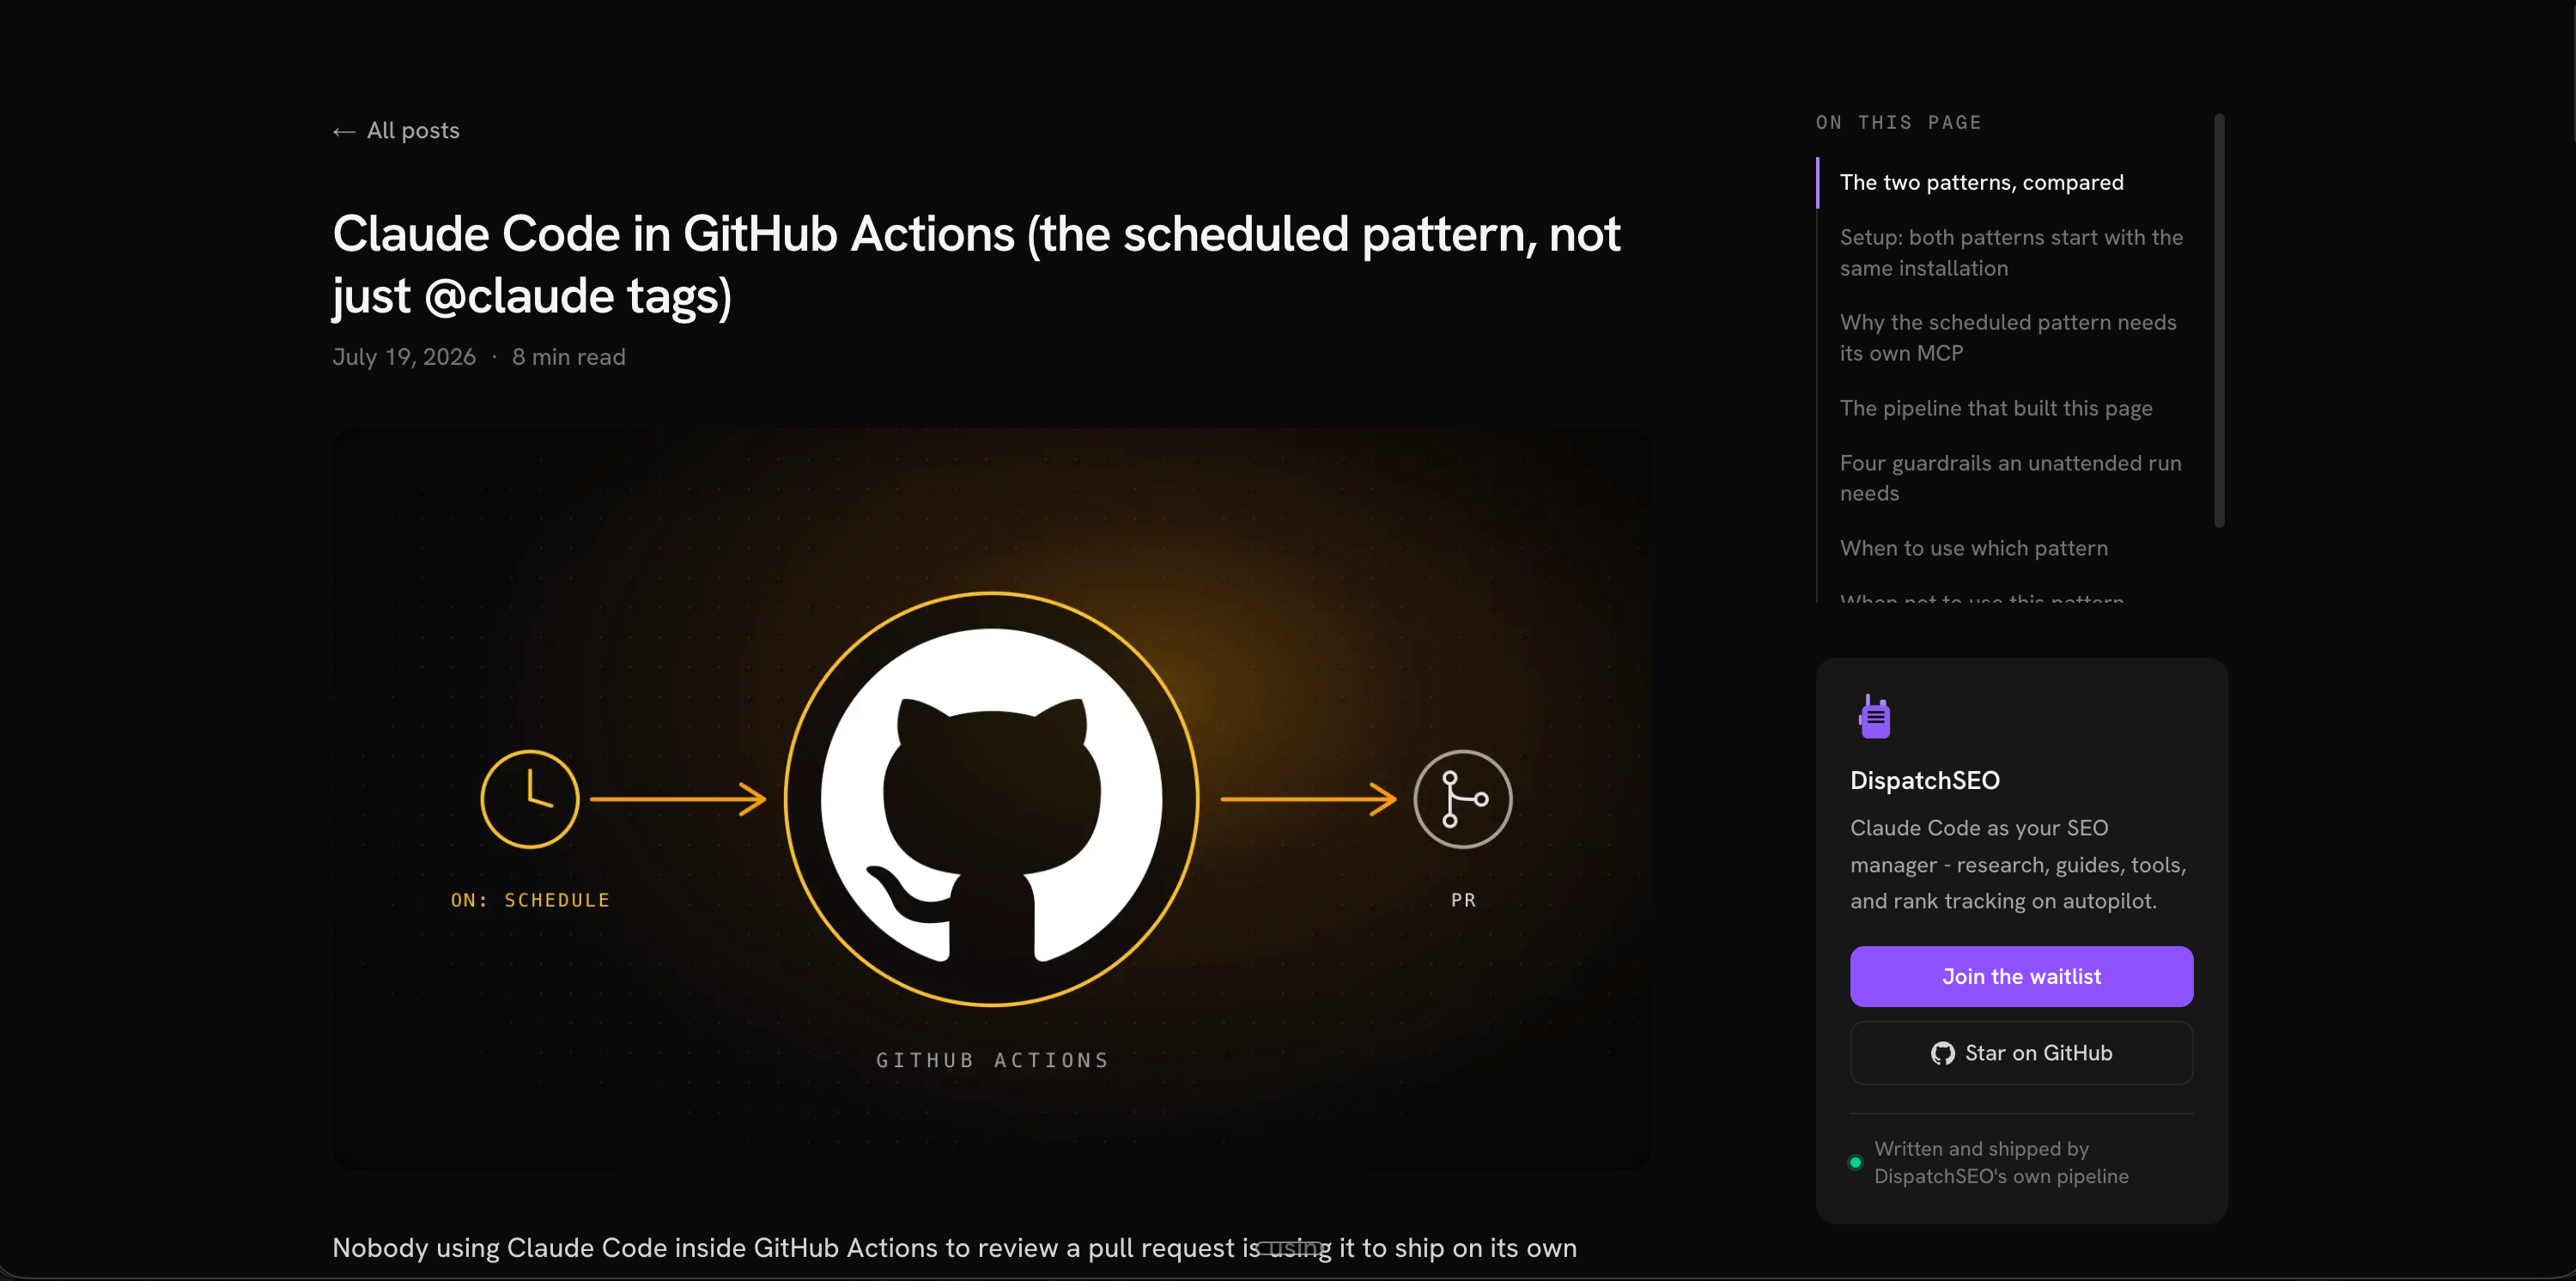
/pages is the published ledger for guides only: every one shipped to the
site, newest first, with its Google/Bing index status and its clicks and
impressions over the last 28 days. A stat row totals guides published,
how many are indexed, and total clicks. Read-only - it fills in as the
daily builder ships pages.
Tools
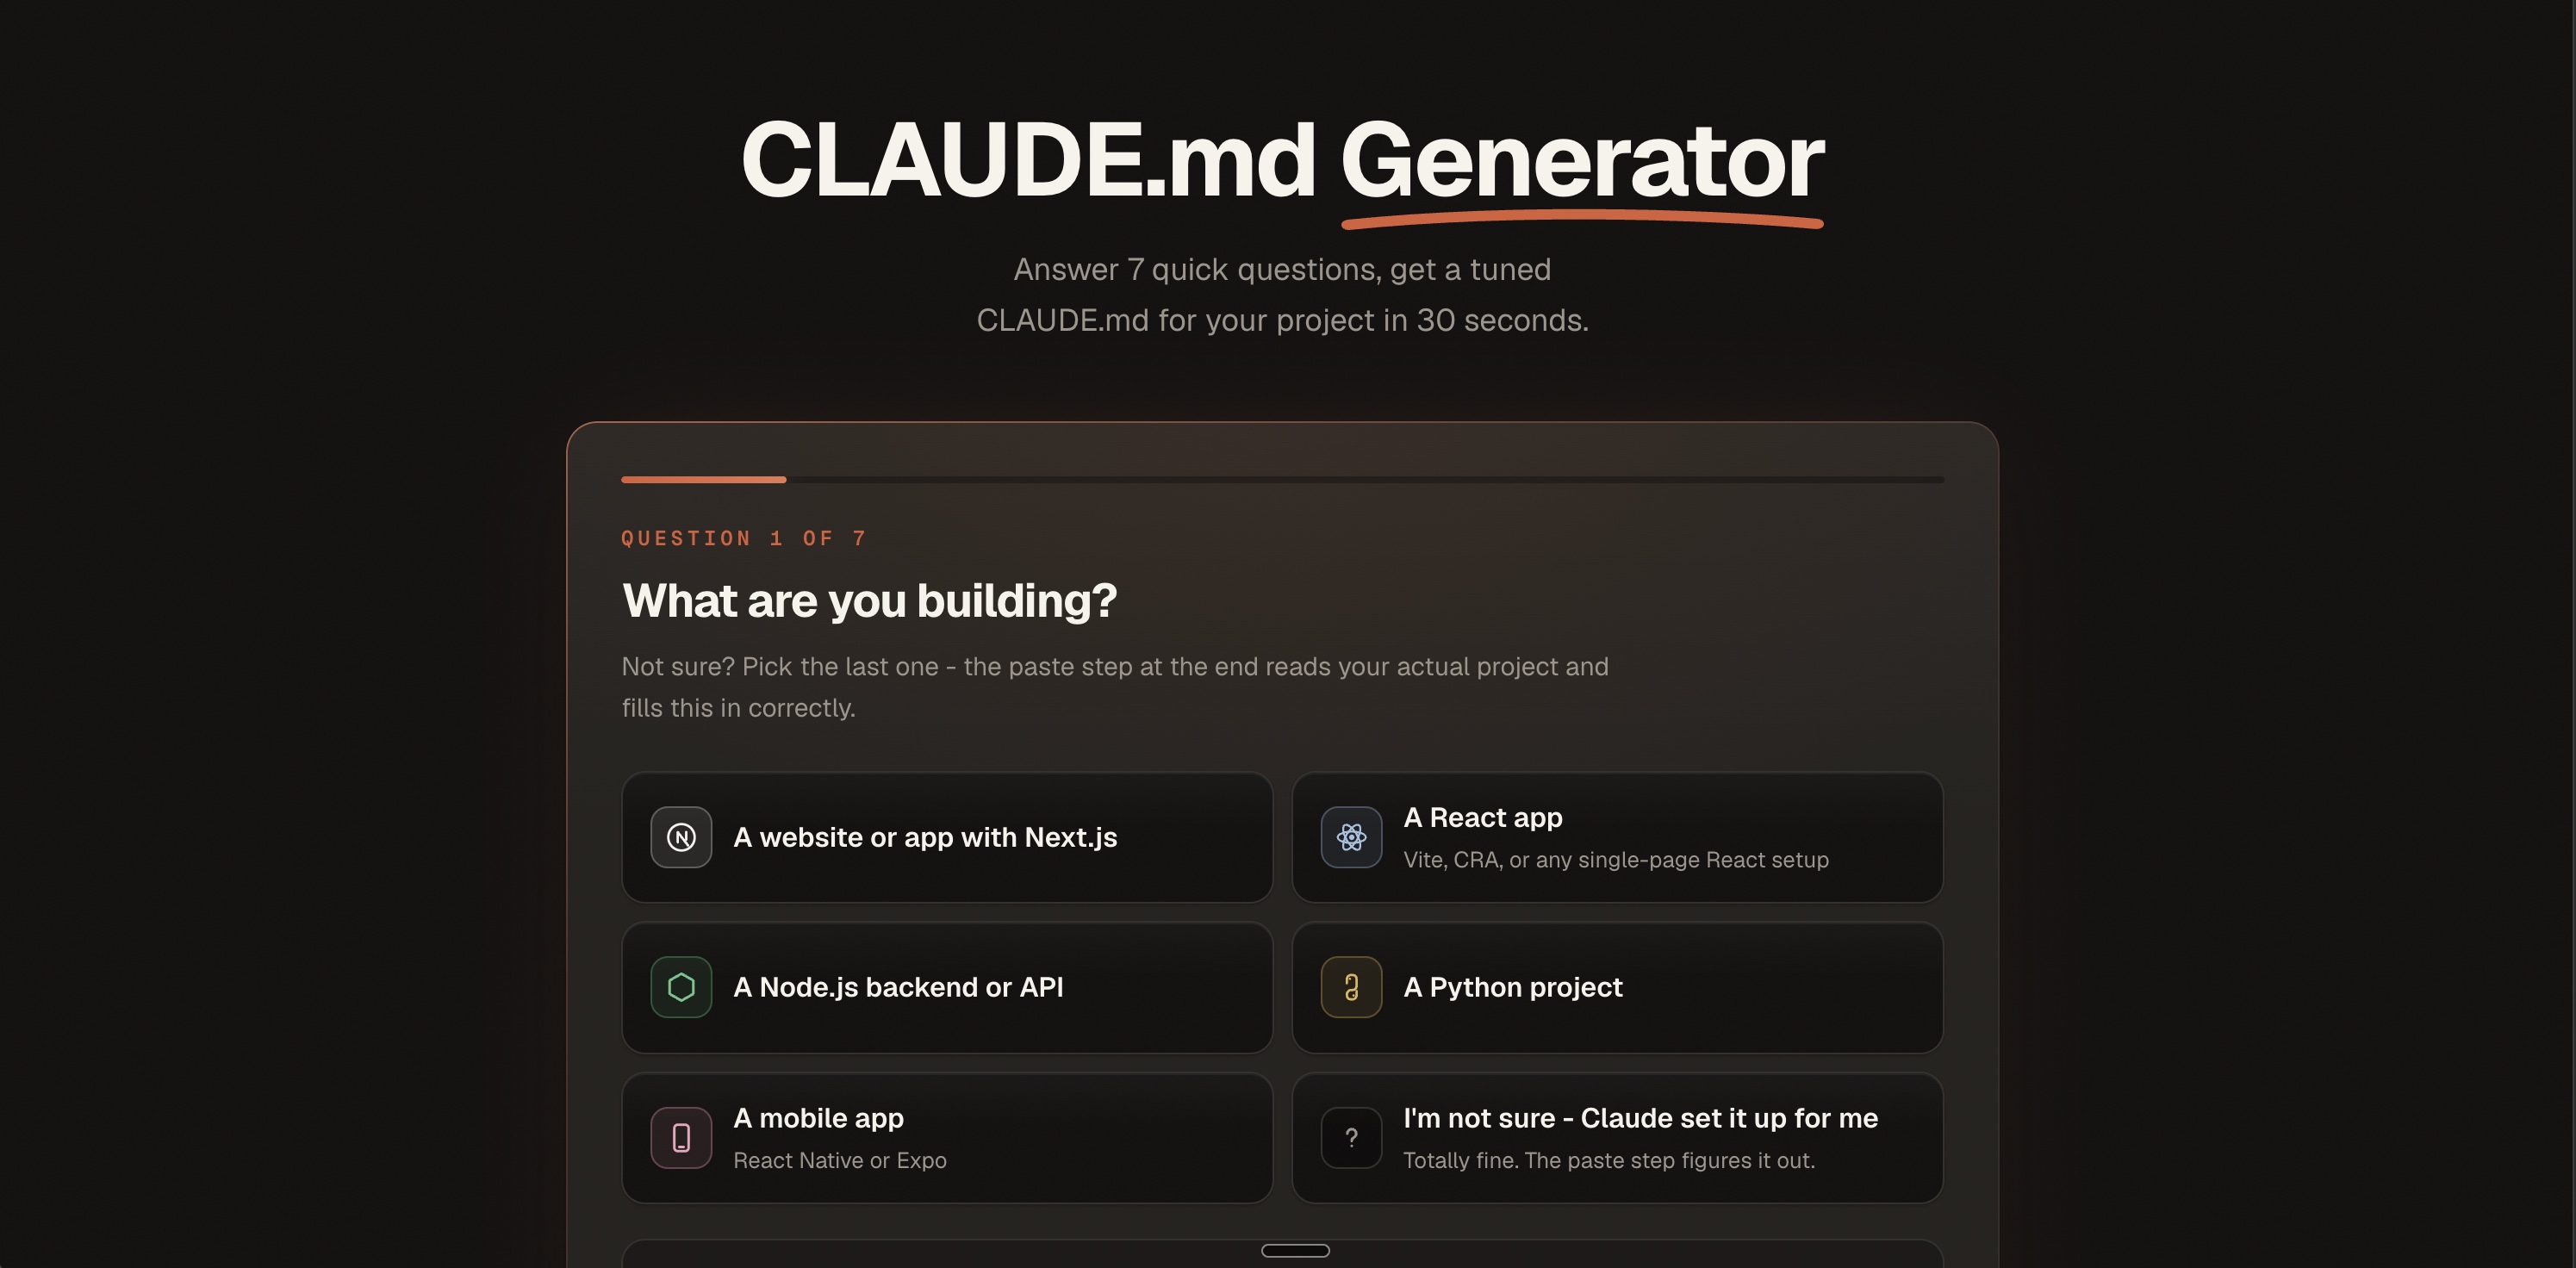
/tools is the same ledger for interactive tools, plus an Add your own
idea card (tool ideas can be queued directly from here, not only from
research). Same columns as Guides: index status, clicks, impressions.
Backlinks
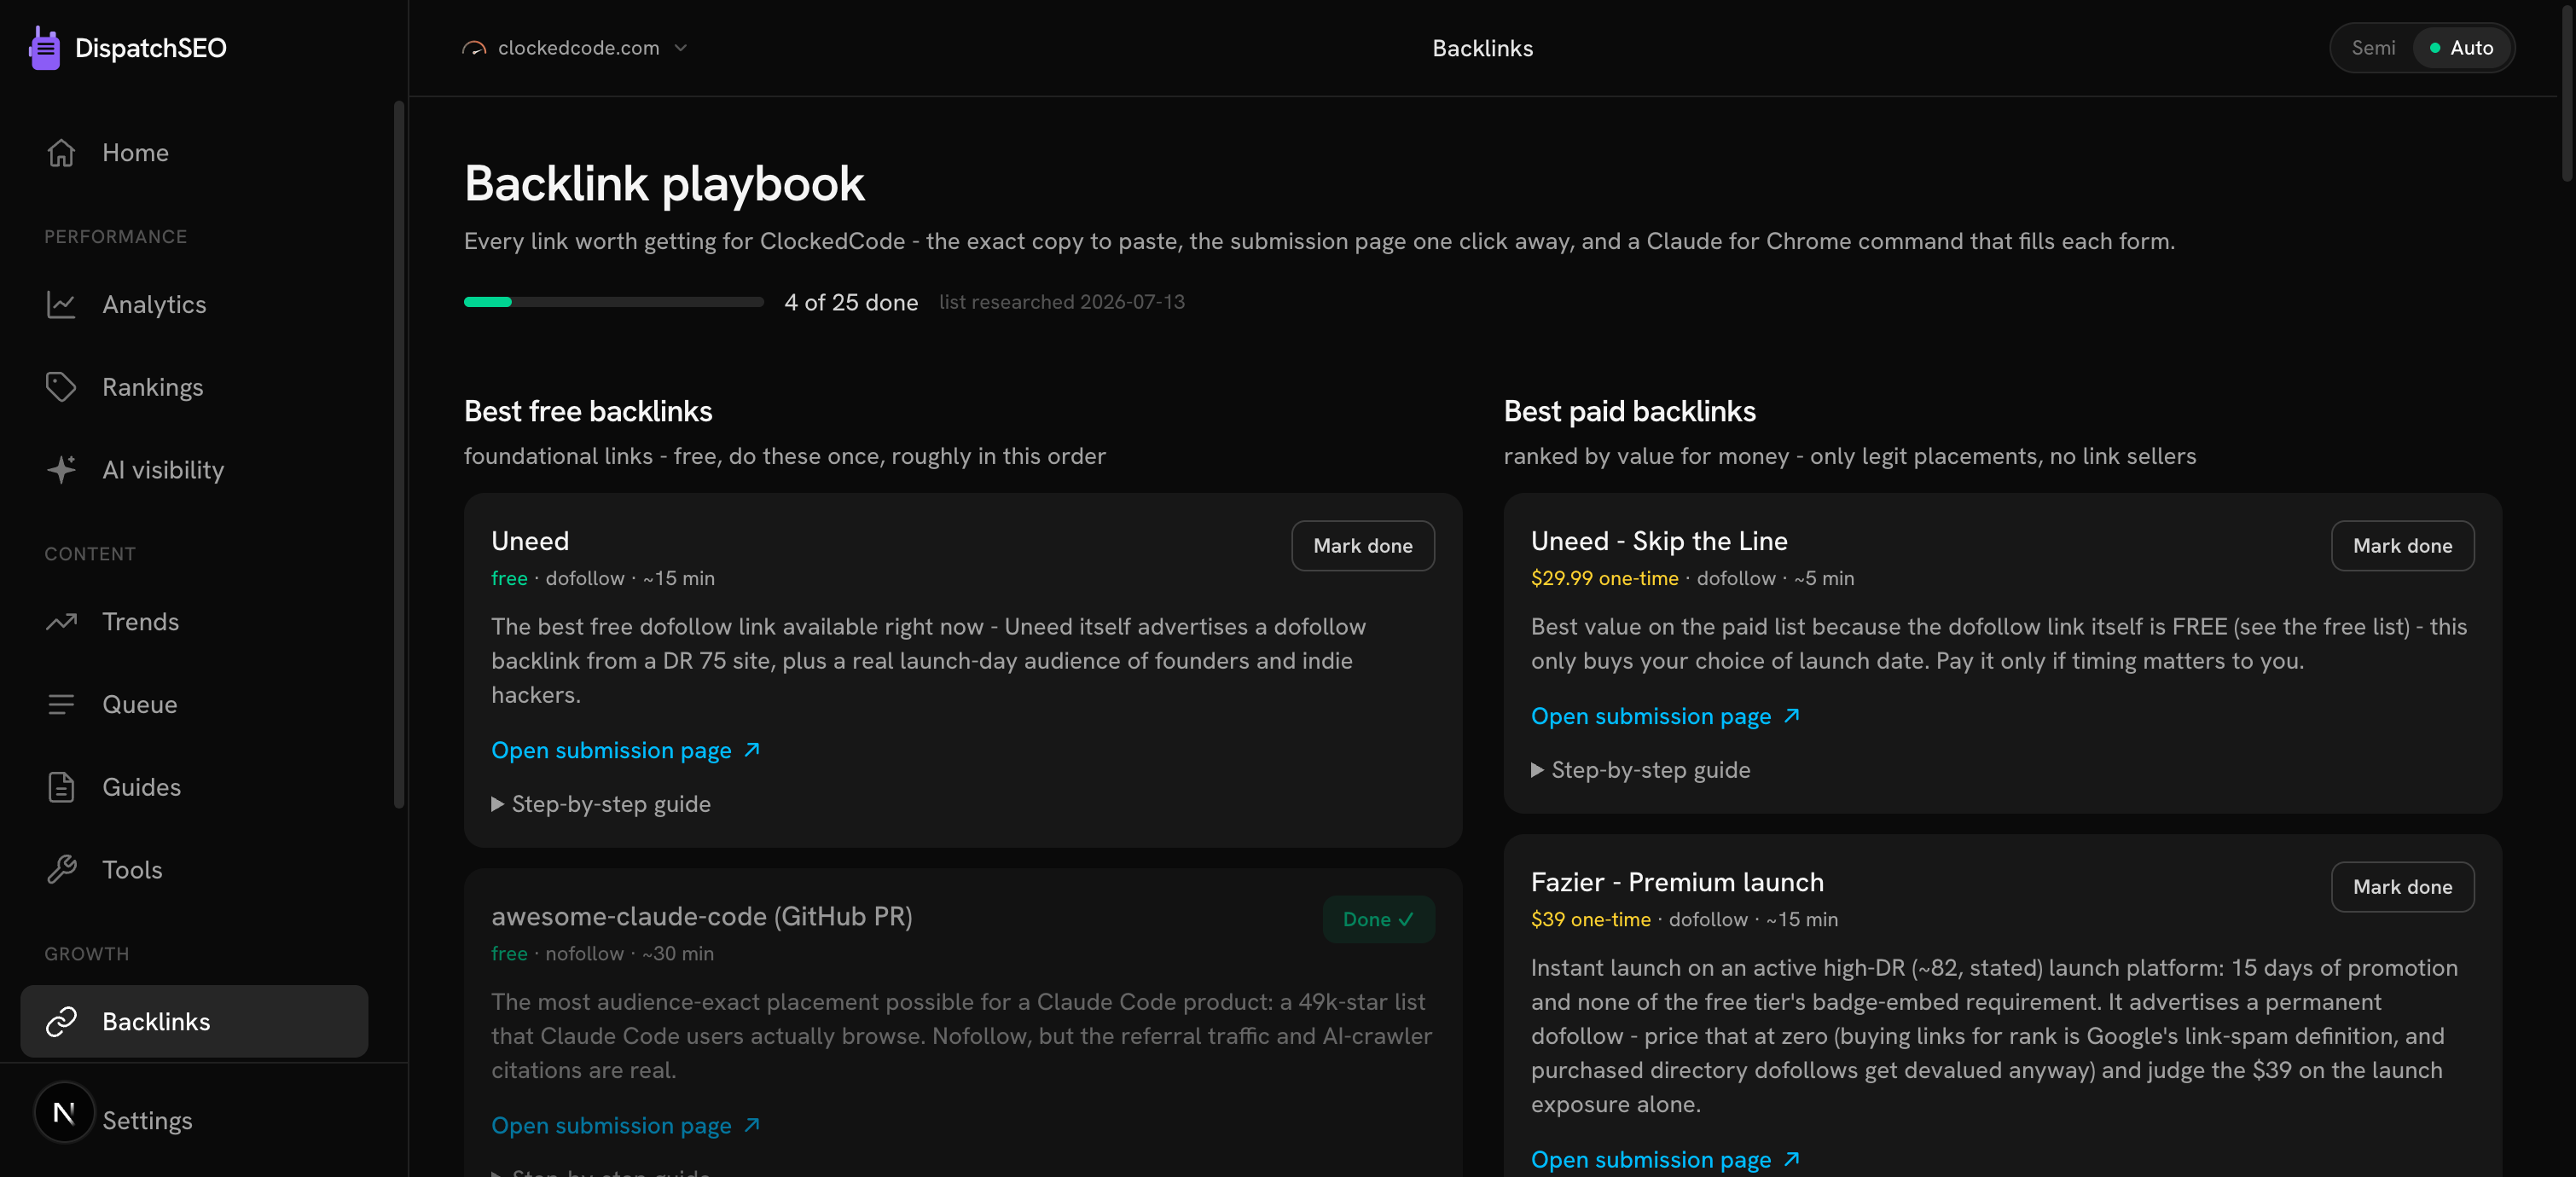
/backlinks is the backlink playbook: a curated list of the best free and
paid backlinks for this specific product, each with the exact copy to
paste, a link straight to the submission page, and (behind a disclosure)
step-by-step instructions plus a Claude for Chrome command that fills the
form for you. A progress meter tracks how many are done. Below that, a
Do not buy list names the traps that poison a backlink profile instead
of growing it, and a Backlink prospects table holds agent-researched
outreach targets from /seo-backlinks, where you track outreach status
per domain (a prospect stuck on "contacted" for 30+ days gets a stale-nudge
label).
Automations
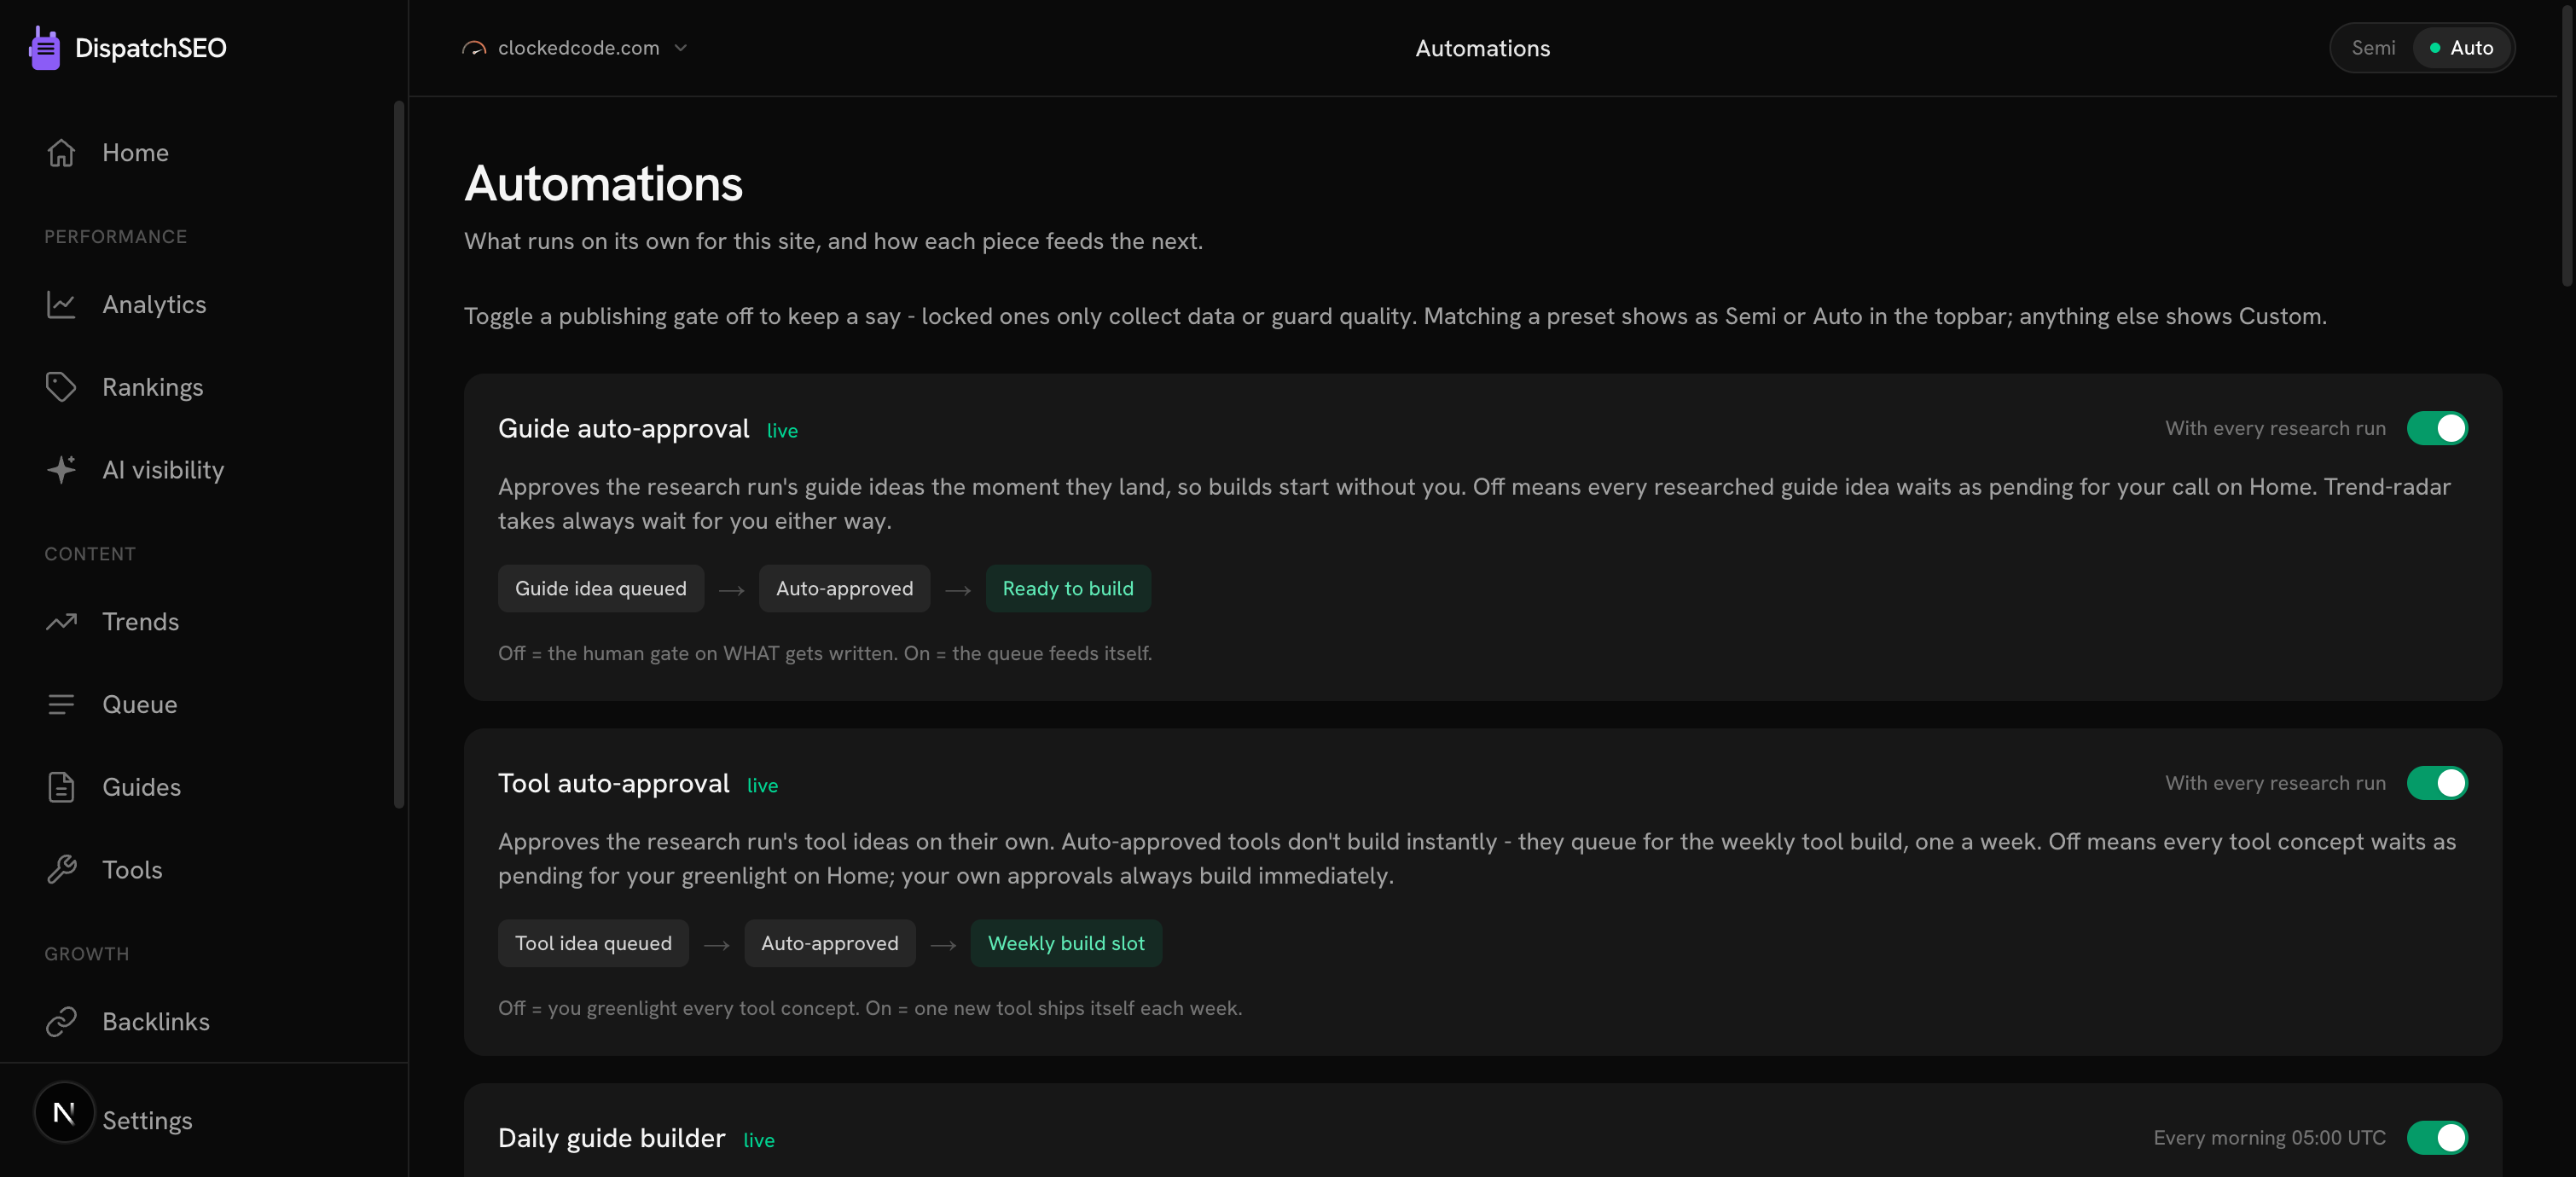
/automations is where you decide how hands-off the pipeline runs - see
Automations and modes for the full breakdown of every
automation and what Semi, Auto, and Custom mean.
Instructions
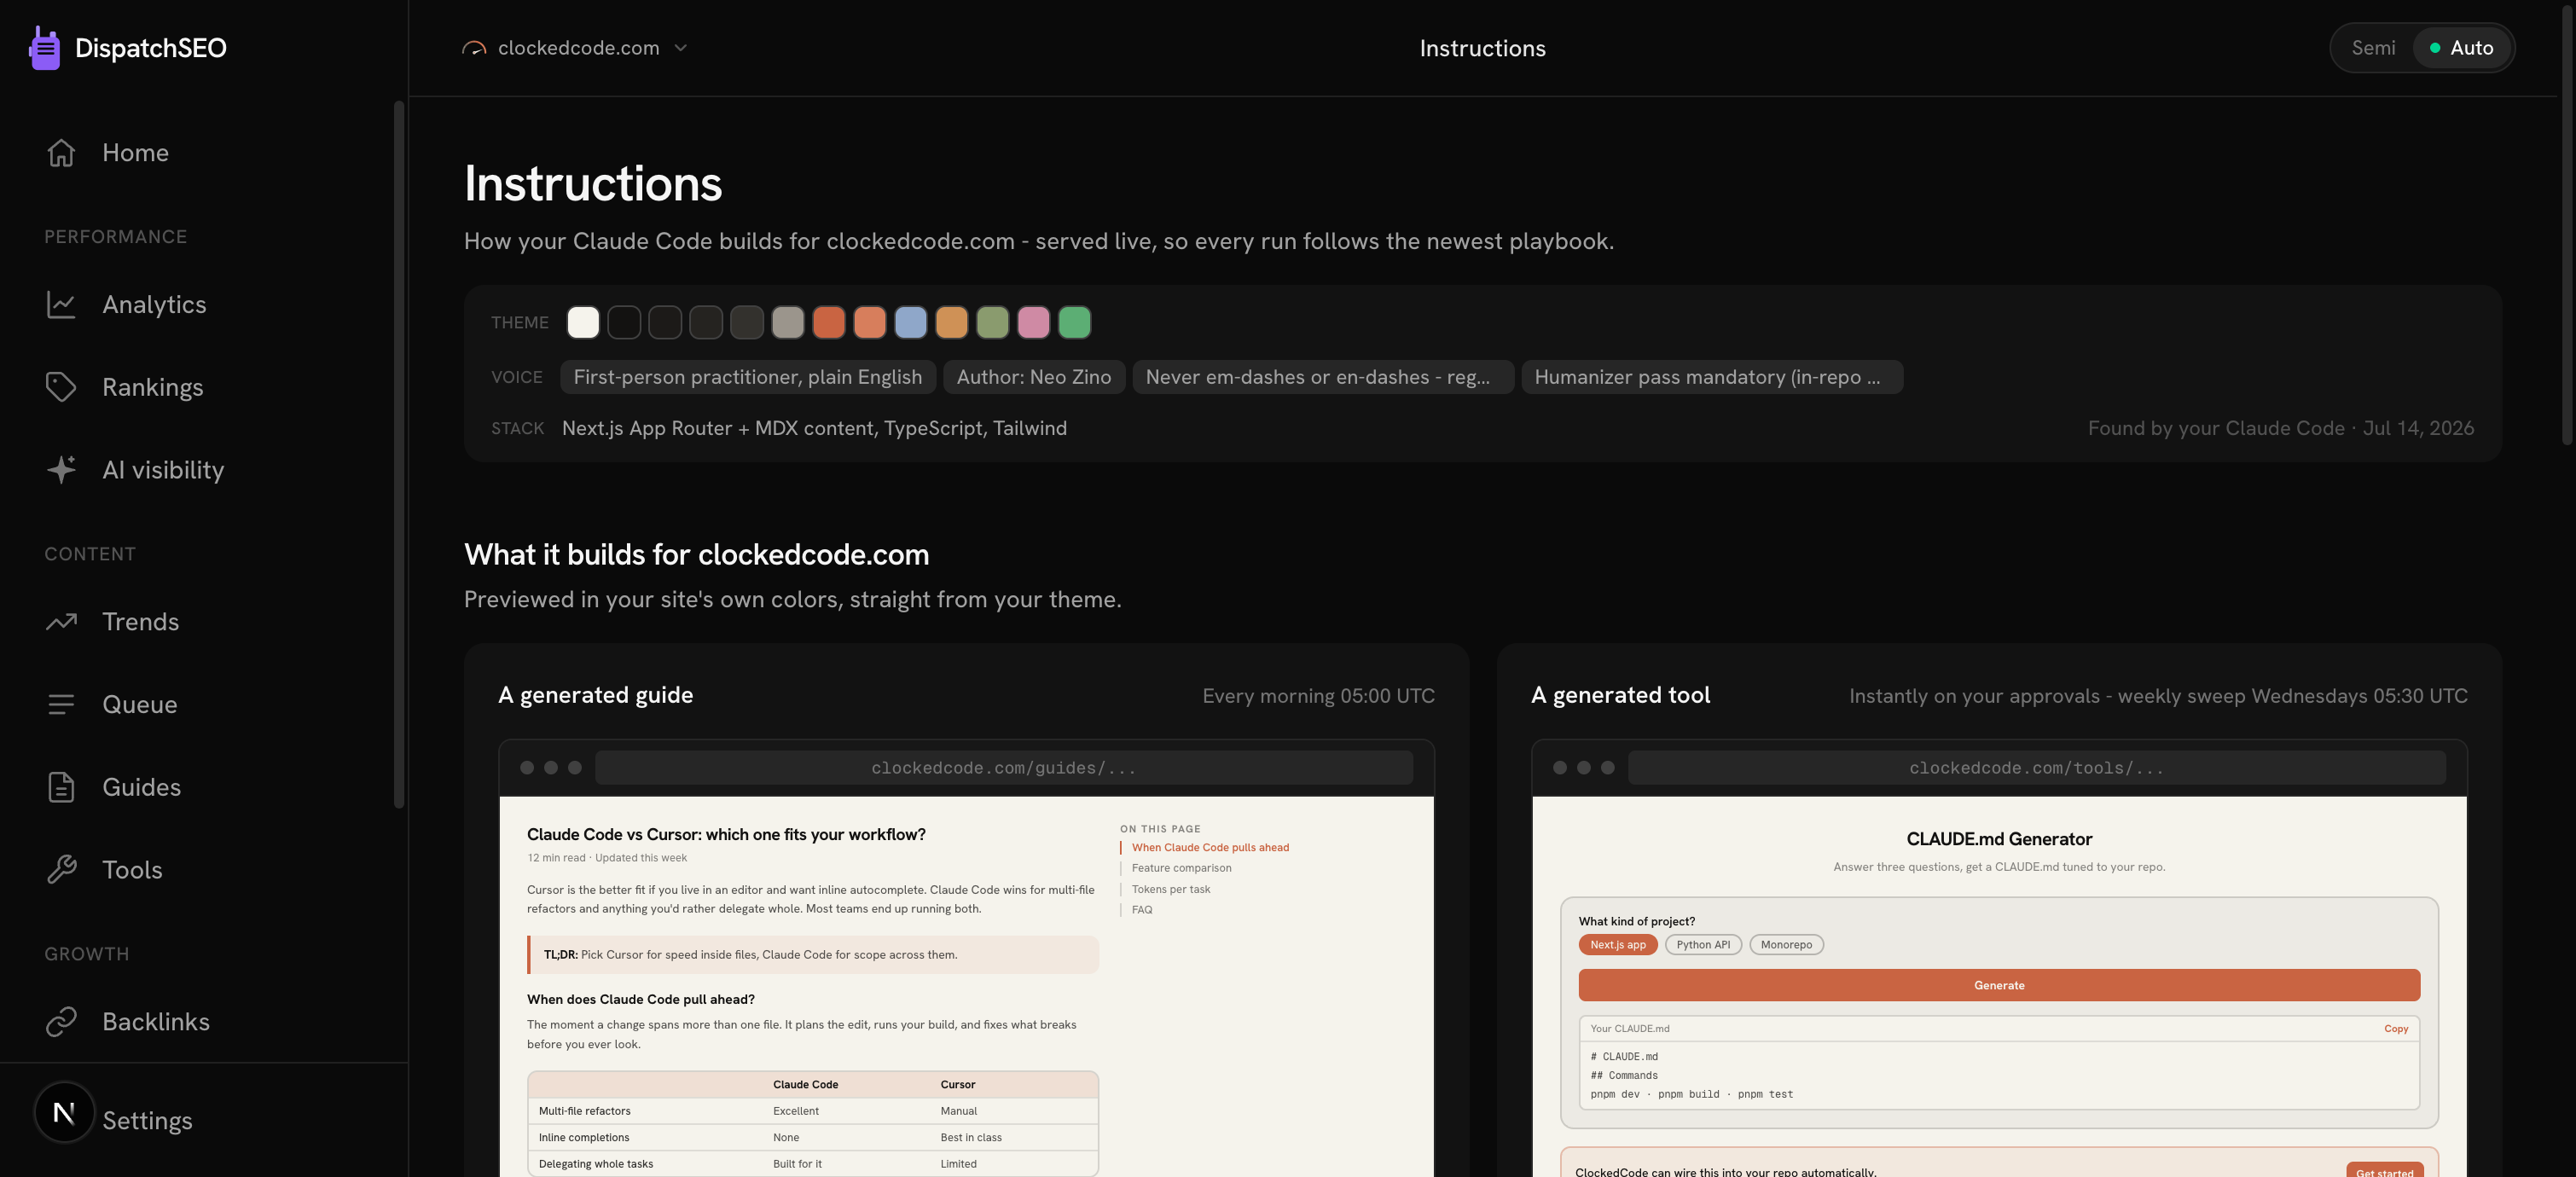
/instructions is a "show, don't tell" page. It renders two live wireframe
previews - a generated guide page and a generated tool page - painted in
the site's own actual theme colors, pulled from
.dispatchseo/conventions.md. A facts strip above them shows what your
own coding agent found when it ran setup: theme tokens, voice rules, stack.
The guide wireframe is also the control surface: click any block in it - cover image, TL;DR, comparison table, bespoke visuals, FAQ - to drop it from every future build, or click it again to bring it back. All five are on by default. The cover image is the one worth knowing about: every guide ships with cover art your agent draws itself as line art about that post's actual subject, so your blog index doesn't read as a wall of identical cards. No image model is involved and it costs nothing beyond a small slice of the build's own tokens - but if you'd rather your cards kept their own look, turn the block off and builds stop drawing them (and stop being told how).
A House rules editor lets you tune the plain-English preferences every build obeys (guide length, tone, and similar knobs) without touching code. An Also in the playbook strip lists the smaller workflows - research, backlinks, reporting, setup - with their steps and cadence.
If setup hasn't run yet for this project, the page shows a Not adapted to this site yet card instead, with the command to run.
Search Console
/google connects the traffic data source. On a cloud project this is
one-click OAuth: press connect, sign in with the Google account that owns
the property, and the page shows every property that account can see plus
a live 28-day sample query proving the connection actually works. Switch
which property is tracked right there if the wizard guessed wrong.
On self-host, OAuth is usually not configured (it needs
GOOGLE_OAUTH_CLIENT_ID / GOOGLE_OAUTH_CLIENT_SECRET env vars this page
will ask for if you want it), so the normal self-host path is instead the
service-account JSON described in
Google Search Console and the "Connect Google
Search Console" setup card on Home - both keep working regardless of
whether OAuth is ever set up.
What's new
"What's new" opens the public changelog in a new tab rather than a page
inside the dashboard - it's the same list the get_changelog MCP tool
returns and the /changelog page anyone can read. A banner on the
dashboard itself announces the rare release worth stopping for - a new
control on your screen, something you should act on - the first time you
load a page after it ships. Most releases don't raise one: they go out
near-daily, and a banner every time would only train you to dismiss it
unread. They still land on the changelog.
Coding agent
TopbarThe pill next to the Semi/Auto switch shows which coding agent runs this project's scheduled builds. Click it for a dropdown of the agents you've already added, each with a one-click switch. Agents you haven't set up aren't listed as though you should be using them - Add agent opens a picker instead, you paste that agent's key, it's verified against the provider before anything is stored, and only then does the agent join the list. Each entry carries its credential status: ready, needs a key, or - when the check genuinely couldn't run, which on cloud means a lapsed GitHub App install - unknown, with a reconnect prompt rather than a guess.
Switching only changes who runs the unattended builds; whatever agent
you have connected over MCP keeps driving everything interactively. It
takes effect on the next scheduled run, with no change to your repo. The
same controls, with more room, live on Settings below - and the agent
over MCP can do it too, with set_agent (see
MCP tools).
Settings
Footer/settings shows the account you're signed in to, then this project's
facts (name, domain, GitHub repo, Search Console property, DataForSEO
connection, publish mode, site-launched date - several of these are
editable inline), the keyword data source picker, a Coding agent
section (a switch card per agent you've added, plus a tabbed key box for
pasting a Claude Code token, an OpenAI key, or a Cursor API key - each
verified before it's stored, with a green check on every agent whose key
is confirmed in place; the ?credential= links the topbar switcher hands
you open straight onto the right tab), the
project's MCP key with its ready-to-paste connect command, a cron key
(self-host only - the key your scheduled jobs use to call this backend),
and a danger zone for deleting the project or the whole account. The home
project can't be deleted. With no project yet, the page still shows your
account and a way to close it.
Billing
Cloud only/billing shows your current plan, the three tiers with their site
limits, and the sidebar's Billing row carries a short badge of that plan
- Starter, Growth, Scale, or Free trial during your first seven days -
so you can see what you're on from any page without coming here. It also
shows a DataForSEO usage meter for bundled-plan customers (with
a note if usage has slowed or capped rank checks for the rest of the
period), and links out to the Polar-hosted checkout and billing portal for
invoices, payment method, and cancellation. Self-hosted deployments have no
billing at all - both
/billingand/plansredirect straight to/dashboardthere.
Log out
A plain link, not a page - it signs you out, clears the dashboard cookie, and resets the local analytics identity so a shared computer's next sign-in never gets linked to the previous session.
Two old URLs that still work
/new redirects to /dashboard?add=1, which opens the add-site dialog on
whatever page you land on - it used to be its own form. /playbook
redirects to /backlinks, which absorbed it. Both exist only so old
bookmarks and links keep working.
Everything here also works from chat
Every one of these pages has an MCP equivalent - reading a table, approving a suggestion, toggling an automation, reordering the queue, all of it is also a tool call the agent can make from agent chat. That parity is a hard rule in this codebase: a dashboard feature without a matching MCP tool is considered unfinished. See MCP tools for the full list.